Showing posts with label PISA. Show all posts

Monday, April 1, 2019

They really are smart ... and other surprises


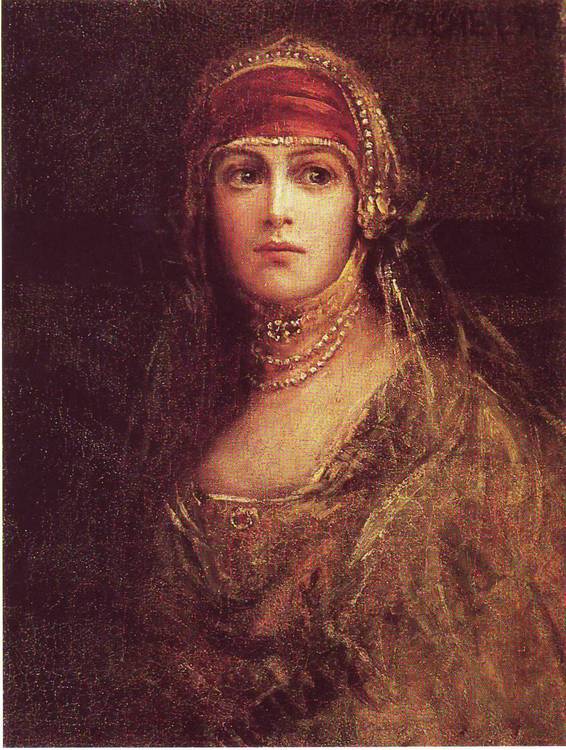
Rachela - Maurycy Gottlieb (1856-1879) (Wikicommons). Ashkenazi Jews have a higher incidence of genetic variants associated with high educational attainment.


Intelligence varies from one individual to the next, and most of this variance has genetic causes. But what, exactly, are these causes? Lots and lots of genes, it seems. To be precise, if we look at the genes that influence human intelligence, we find two things:

1. They are very numerous, numbering in the thousands.

2. In general, their variants differ slightly in their effects.

This shouldn't be surprising. Evolution proceeds by tinkering, i.e., by making little changes. Big changes tend to produce big side-effects, and most side-effects are deleterious. So the genetic capacity for intelligence differs among humans through small differences at thousands upon thousands of genes. Does it follow, then, that we cannot understand these differences by looking only at a few genes? Not necessarily. Each gene is like a weathervane. If you can get enough subjects from a human population, even a few genes will tell you the direction and strength of natural selection for intelligence. 

Davide Piffer began looking at these “weathervanes” six years ago. He gathered data from different human populations on ten SNPs (single nucleotide polymorphisms) whose genetic variants are associated with differences in intelligence, specifically differences in educational attainment. Then, for each population, he estimated its genetic capacity for intelligence by calculating a "polygenic score"—the number of genetic variants associated with higher educational attainment, out of a maximum of ten.

This score correlated with population IQ (r=0.90) and with PISA scores (r=0.84). It was highest in East Asians:

East Asians have the highest frequencies of alleles beneficial to educational attainment (39%) and consistently outperform other racial groups both within the US and around the world, in terms of educational variables such as completion of college degree or results on standardized tests of scholastic achievement. Europeans have slightly lower frequencies of educational attainment alleles (35.5%) and perform slightly worse in terms of educational attainment, compared to East Asians. On the other hand, Africans seem to be disadvantaged both with regards to their level of educational attainment in the US and around the world. Indeed, Africans have the lowest frequencies of alleles associated with educational attainment (16%). (Piffer 2013)

These results were considered preliminary. Thousands upon thousands of genes influence intelligence, and here we have only ten! Perhaps chance alone produced this geographic pattern. Over the next few years, as other researchers discovered more SNPs associated with educational attainment, Davide Piffer repeated his study with more of these weathervanes.

His latest study has just come out. It uses data on 2,411 SNPs, and the polygenic score correlates even higher with population IQ (r=0.98). The geographic pattern is the same, with East Asians scoring higher than Europeans, and with Africans scoring lower.


Yes, Jews really are smart

This time, however, the highest score was obtained for Ashkenazi Jews: 

This dataset included a sample of 145 Ashkenazi Jewish individuals. The IQ of Ashkenazi Jews has been estimated to be around 110 [34]. Remarkably, their EDU polygenic score was the highest in our sample, corresponding to a predicted score of about 108, mirroring preliminary results from a smaller (N = 53) sample (Dunkel et al., 2019) [34]. (Piffer 2019)

This finding vindicates the authors of a paper written more than a decade ago. Gregory Cochran, Jason Hardy, and Henry Harpending presented evidence that the mean IQ of Ashkenazi Jews exceeds not only that of non-Jewish Europeans but also that of other Jewish groups. The most striking piece of evidence is the high incidence among Ashkenazim of four genetic disorders: Tay-Sachs, Gaucher, Niemann-Pick, and mucolipidosis type IV (MLIV). All four affect the capacity to store sphingolipid compounds that promote the growth and branching of axons in the brain. These disorders are caused by alleles that are harmful in the homozygote state and beneficial in the much more common heterozygote state, i.e., the brain receives higher levels of sphingolipids without the adverse health effects.

Ironically, these facts are coming to light at a time when Ashkenazi Jews are disappearing through low fertility and high out-marriage. Meanwhile, and not coincidentally, they are disappearing from the ranks of top winners at the U.S. Math Olympiad, the Putnam Exam, the Computing Olympiad, and other academic competitions. This decline became noticeable in the 1980s and has accelerated since the turn of the millennium (Unz 2012; Frost 2018). Jews are still present in intellectual and cultural life, but this presence is losing its dynamism and becoming a mere legacy.


African American IQ is higher than predicted

The polygenic score seems to underpredict the IQ of African Americans:

Indeed, the IQ of African Americans appears to be higher than what is predicted by the PGS (Figure 2), which suggests this cannot be explained by European admixture alone, but it could be the result of enjoying better nutrition or education infrastructure compared to native Africans. Another explanation is heterosis ("hybrid vigor"), that is the increase in fitness observed in hybrid offspring thanks to the reduced expression of homozygous deleterious recessive alleles. (Piffer 2019)

I’d propose another possible explanation: higher intelligence in African Americans may be associated with a somewhat different basket of genetic variants. Some of these variants may come from our friends the Igbos, who seem to have followed their own evolutionary path toward higher intelligence (Frost 2015). Many notable African Americans are in fact of Igbo descent, including Forest Whitaker, Paul Robeson, and Blair Underwood (Wikipedia 2019).

Davide is skeptical about this explanation, pointing out that population IQ is in line with the polygenic score he calculated for sub-Saharan African groups (Esan, Gambians, Luhya, Mende, Yoruba). None of those groups, however, are Igbo, and it's really the Igbo who stand out among West Africans in measures of intellectual and educational attainment. If only for the sake of curiosity, we should find out their polygenic score. This score may underpredict their genetic capacity for intelligence, which to some degree would be boosted by genetic variants that exist only in sub-Saharan Africa, but it should still exceed what we see for other West Africans.


Conclusion

This latest study brings to 2,411 the number of SNPs that can inform us about the genetic capacity for intelligence in different human populations. This information was more dubious when only ten SNPs were available, and the geographic pattern could be put down to chance. That argument now seems weak. If chance is causing this pattern, why do we keep getting the same one?

Sure, we can wait until we get even more relevant SNPs, but the overall picture will probably remain the same. We will get finer geographic detail. In France, for example, we will probably understand why educational attainment is so much higher in Brittany (see:  http://www.targetmap.com/viewer.aspx?reportId=5987  H/T to Philippe Gouillou). There are probably several European regions and subregions where the genetic capacity for intelligence is on a par with what we see in Ashkenazi Jews and East Asians.

In sum, these findings deserve to be better known ... and more widely discussed.


Erratum

Initially, I wrote that Davide Piffer used 127 SNPs. In fact, 127 is the number of SNPs found in the HGDP (low coverage) dataset. In the other two datasets (1000 Genomes and GnomAd), those that the main analysis was based on, there were actually 2,411 SNPs.


****
Hiatus alert ****


I'll be unable to post for the near future, probably the next three months. 


References

Cochran, G., J. Hardy, and H. Harpending. (2006). Natural history of Ashkenazi intelligence, Journal of Biosocial Science 38: 659-693.
https://antville.org/static/sites/kratzbuerste/files/AshkenaziIQ.pdf   

Frost, P. (2018). The end of Jewish achievement? Evo and Proud, May 21
http://evoandproud.blogspot.com/2018/05/the-end-of-jewish-achievement.html

Frost, P. (2015). The Jews of West Africa, Evo and Proud, July 4
https://evoandproud.blogspot.com/2015/07/the-jews-of-west-africa.html

Piffer, D. (2019). Evidence for Recent Polygenic Selection on Educational Attainment and Intelligence Inferred from Gwas Hits: A Replication of Previous Findings Using Recent Data. Psych 1(1): 55-75
https://www.mdpi.com/2624-8611/1/1/5

Piffer, D. (2013). Factor analysis of population allele frequencies as a simple, novel method of detecting signals of recent polygenic selection: The example of educational attainment and IQ, Mankind Quarterly 54(2): 168-200
https://www.researchgate.net/profile/Davide_Piffer/publication/260436834_Factor_Analysis_of_Population_Allele_Frequencies_as_a_Simple_Novel_Method_of_Detecting_Signals_of_Recent_Polygenic_Selection_The_Example_of_Educational_Attainment_and_IQ/links/0c9605314d28dba7ea000000/Factor-Analysis-of-Population-Allele-Frequencies-as-a-Simple-Novel-Method-of-Detecting-Signals-of-Recent-Polygenic-Selection-The-Example-of-Educational-Attainment-and-IQ.pdf 

Unz, R. (2012). The myth of American meritocracy. The American Conservative, November 28
http://www.theamericanconservative.com/articles/the-myth-of-american-meritocracy/   

Wikipedia (2019). Igbo people.
https://en.wikipedia.org/wiki/Igbo_people#Diaspora

Saturday, March 8, 2014

Population differences in intellectual capacity: a new polygenic analysis


PISA test documents at a German school (source: Theo Müller). PISA and IQ tests are informing us about differences in intellectual capacity by country. Meanwhile, genetic studies are informing us about genomic differences by country. Davide Piffer has been tapping into these two pools of data to explore the links between genes and intellectual capacity.
 

Between individuals and populations, intellectual capacity seems to differ through small differences at many genes. This is hardly surprising. Intelligence is a complex trait that involves many different genes interacting with each other and with the environment. If one gene changes, the immediate effect may be beneficial, but there will be side effects at other genes, and most of those side effects will likely be harmful. The bigger the effect at any one gene, the greater the likelihood of negative side effects elsewhere.

So evolution has proceeded through tinkering. A small effect here, a small effect there, but nothing that will rock the boat.

We must therefore pool data from many genes to understand the evolution of complex traits like intelligence. This is what Davide Piffer (2013) has done in a recent study. He began with seven genes (SNPs) whose different alleles are associated with differences in intellectual capacity, as measured by PISA or IQ tests. Then, for fifty human populations, he looked up the prevalences of the alleles that seem to increase intellectual capacity. Finally, for each population, he calculated their average prevalence at all seven genes.

The average prevalence was 39% among East Asians, 36% among Europeans, 32% among Amerindians, 24% among Melanesians and Papuan-New Guineans, and 16% among sub-Saharan Africans. The lowest scores were among San Bushmen (6%) and Mbuti Pygmies (5%). A related finding is that all but one of the alleles seem to be derived. In other words, they are specific to humans and not shared with ancestral primates.

Since these alleles have only small effects on intellectual capacity, there might be other causes for the above geographic pattern. For instance, as modern humans spread out of Africa, older alleles would have gradually given way to newer ones simply through founder effects and other random events. On the other hand, these derived alleles do not reach their highest prevalence in populations that are farthest removed from Africa, like the native inhabitants of the Americas and Oceania. The highest prevalences are actually reached less far away, in Europe and East Asia. Furthermore, the African/non-African difference is much greater for these alleles than for derived alleles in general. Derived alleles typically have a prevalence of 42% among sub-Saharan Africans and 56-57% among East Asians and Europeans (Watkins et al., 2001). This difference is tiny in comparison to the one for alleles that seem to increase intellectual capacity.
 

Principal component analysis

In this study and in a subsequent one (Piffer, 2014), principal component analysis has shown that a single factor explains much of the variability in the data (45%). Moreover, this one factor correlates highly with average IQ scores (r=0.9) and PISA scores (r=0.8) for each population. A common neural property thus seems to be the target of the various derived alleles. Could it be the elusive g factor?

The existence of such a large factor is further proof that we are dealing with some kind of selection pressure, and not random genetic changes like founder effects. It doesn’t follow, however, that the “unexplained variability” is without significance. Selection for intellectual capacity, like selection for any complex trait, may follow different paths in different cultural contexts. Moreover, there may be tradeoffs between different kinds of mental ability, and these tradeoffs may likewise vary according to the cultural context.
 

A final caveat

These seven genes are a small subset of the many genes that affect intellectual capacity. They thus provide only a rough picture of how this trait varies within the human species. Nonetheless, this picture is probably not far from reality. 
 

References

 
Piffer, D. (2013). Factor analysis of population allele frequencies as a simple, novel method of detecting signals of recent polygenic selection: The example of educational attainment and IQ, Interdisciplinary Bio Central, provisional manuscript
http://www.ibc7.org/article/journal_v.php?sid=312 

Piffer, D. (2014). Simple statistical tools to detect signals of recent polygenic selection, Interdisciplinary Bio Central, 6, article 1
http://www.ibc7.org/article/journal_v.php?sid=317

Watkins, W.S., C.E. Ricker, M.J. Bamshad, M.L. Carroll, S.V. Nguyen, M. A. Batzer, H.C. Harpending, A.R. Rogers, and L.B. Jorde. (2001). Patterns of ancestral human diversity: An analysis of Alu-insertion and restriction-site polymorphisms, American Journal of Human Genetics, 68, 738-752.

Saturday, July 28, 2012

More on Race, IQ, and Wealth


Cover page of American Conservative, a megaphone for dubious science? (source)

My comments on Ron Unz’s article “Race, IQ, and Wealth” have led to further exchanges between myself and Ron. There seem to be two sticking points:


  1. Ron is more like a military strategist than an academic. In other words, the goal is already decided on, and all that remains is to work out the best strategy for reaching that goal. For him, the optimal strategy is to find the weakest point in the enemy’s defenses and to hammer away at it relentlessly. Once that soft spot is breached, the entire defense line will collapse.


  1. Ron sees only “perfect” evidence and “imperfect” evidence (which must be discarded).  This may be just naiveté on his part. Actually, there is no such thing as perfect evidence. There is only evidence with varying degrees of imperfection, and a good academic should view all data with a wary eye, even "Gold Standard" stuff. By the same token, one should not dismiss data that have a high degree of “noise,” unless a better dataset is available.  Such evidence is still useful for picking out general trends and formulating hypotheses for further study.

The following is our exchange of views:


Ron Unz here,

Let me focus upon a single experimental datapoint, of which there actually exist a considerable number. Lynn provides three Irish IQ samples: a 1972 sample of 3,466 yielding an IQ of 87, a 1993 sample of 1,361 yielding an IQ of 93, and another 1993 sample of 2,029 yielding an IQ of 91. These are all very large samples. There is also another minuscule 1979 sample of 75 which (unsurprisingly) yields an outlying value. All these results are Flynn-adjusted by Lynn.

[…] However, in America Irish these days have IQs slightly above the white average, and in Europe the recent PISA scores for Ireland are also right around those for Germany, France, and Britain.

Now my hypothesis is that the huge recent rise in Irish IQs is probably due to changes in urbanization and socio-economic factors. But perhaps I'm entirely wrong. So, then, what is the alternate hypothesis explaining these wildly different Irish IQ scores across  just a 35 year period?


[Answer to question about how one defines “American Irish” ]

Being "Irish" is based on self-identification and reporting, so I'd certainly expect that most of the "American Irish" aren't "pure Irish."

But none of that makes a difference. If the Irish had an actual, innate, genetic IQ of 87, and this figure was not subject to rapid change under socio-economic influences, there would be *massive* evidence of this in American society.

For example, something like 15% of all the Irish in America would have IQs below 70, and would be subject to clinical mental retardation. Do you really believe that 15% of all American Irish are mentally retarded?

Okay, maybe lots of those Irish aren't pure Irish, and are part German or Italian or something. Well, according to Lynn the (South) Italian IQ is around 89, so that wouldn't really help much. But anyway, we'd still be seeing millions of mentally-retarded Irish-Americans. Do you believe that?

Here's another point. During the 1970s, the Wordsum-IQ gap between rural whites and urban/suburban whites was almost exactly the same as the black/white gap. Again, that implies that something like 10% of all white farmboys during the 1970s were mentally retarded. Do you really believe that?

Finally, as I've pointed out, between the 1980s and the 2000s, roughly 61% of the Wordsum-IQ gap between white Americans and American-born Mex-Ams disappeared due to an enormous rise in the Wordsum-IQ of the latter group. These are hard, empirical facts. Perhaps my explanation is entirely wrong. But what is your alternate explanation?

Ron,

You're pointing at weak evidence as a way to undermine strong evidence. A single IQ test, even with a large sample, is at best a rough indication. The main problem is sample bias. Is the sample truly representative? If the sample comes from a school classroom, you have the problem of absenteeism. Truants tend to be problem students, so the higher the rate of absenteeism, the higher will be the IQ score.

Even if the sample is representative, there are other sources of bias: the amount of coaching for the test and the way the test is presented. These sources of bias may cancel each other out. Or maybe not. One thing is sure: they increase the amount of noise in the data. In your case, you had three data points: 87, 91, and 93. You focused on the lowest of the three figures. How come? Why not take an average? Even then, I would still be skeptical.

I am even more skeptical of your recent data on "Irish Americans." There is no such population. There are simply a lot of people with varying amounts of Irish ancestry. "Irish Americans" are increasingly people who take an interest in Irish music, culture, and history, and such people tend to be more educated than average. Another factor is that people tend to identify with the branch of their family tree that has a stronger sense of ethnic identity. If a person is part English and part Irish, they tend to identify as Irish. But if a person has equal contributions of African and Irish ancestry (like Mariah Carey), they tend to identify as African American.

Finally, Wordsum is not IQ. It has a correlation of 71% with standard IQ tests, which in turn have a correlation of 50 to 75% with innate intelligence. So we are already two steps removed from any genetically transmitted factors.

This is a recurring problem with your line of argument. You present "A" and try to pass it off as "B", hoping that no one will notice the difference.

Ron Unz here:

Don't be ridiculous, Peter. Please do read my arguments more carefully.

(1) The PISA tests are very widely regarded as one of the best current means of estimating the IQs of European countries, certainly by my sharpest critics. If you look at the PISA scores for Ireland, they are almost exactly the same as those for Britain, Norway, Denmark, France, Sweden, and several other European countries. That almost certainly implies that Ireland's current IQ is quite close to 100.

Now an enormous IQ sample provided by Lynn placed Ireland's 1972 IQ at just 87, and Lynn has explicitly confirmed this by stating that his years of late 1960s personal research in Ireland convinced him that the Irish were a low-IQ people, whose only hope lay in a heavy eugenics program. So unless a huge sample and Lynn are both wrong, this is probably correct.

Therefore, some unknown factor—I strongly suspect urbanization—apparently caused a massive rise in Irish IQ between 1972 and today. Further evidence for this rise is shown by the fact that at the half-way point—the early 1990s—two additional huge IQ tests provided by Lynn placed the Irish IQ at around 92, exactly half-way between those two endpoint values.

Bear in mind, that all of these Irish results are about as "Gold Standard" as you can find anywhere—huge IQ samples, Lynn's years of personal research, and PISA. None of it has anything to do with partial Irish ancestry or Wordsum. But the fact that these Ireland Irish results are totally consistent with the separate Irish-American Wordsum results certainly doesn't weaken my case.

(2) Here's another example: Poland. The 1989 Polish IQ results quoted by Lynn are based on the largest sample he's found anywhere, over 4000 individuals. The Flynn-adjusted Polish IQ was 92. Yet just 20 years later, Poland had precisely the same PISA scores as Britain, France, Norway, Sweden, etc, all which Lynn claims have IQs of around 100. How do you explain this?

(3) Essentially, your perspective seems to be that we should just throw away all the Lynn/Vanhanen IQ tests which you don't like---many of which tend to be the largest ones---and keep the ones you do. Or perhaps you're just suggesting we should bite the bullet and throw away ALL of the Lynn/Vanhanen data, and therefore base all our estimates of European IQs on "personal intuition." If that's not what you're saying, please do clarify.

Ron,

A PISA test suffers from the same problem I pointed out earlier. It's based  on students in a classroom. It excludes those students who weren't around on the day of the test. I'm not talking about a small proportion of the youth population either.

And a PISA test is not an IQ test. Like WordSum, its results correlate with those of IQ tests, which in turn correlate with genetic factors that influence human intelligence. Again, you're trying to pass off "C" as "A" by using the argument that C correlates with B and B correlates with A.

The IQ data compiled by Lynn provide weak evidence for heritability of IQ.  There is a lot of noise in that kind of data.  And much of that noise will not be squeezed out by large sample sizes. If there is a bias in participant recruitment, that bias will distort a big sample as surely as it will distort a small one.

With respect to the Polish data, we have the same phenomenon that we see with the East German data. IQ scores were lower during the Communist era than they are today. The most likely explanatory factor is truancy. It is much easier for problem students to skip classes today than it was back then. During the communist era, truants were sent to detention centres that were little more than prisons. No one wanted to go to those places. If you were a pretty boy, you would have to become a "wife" for one of the alpha males.

You ask me:


Your perspective seems to be that we should just throw away all the Lynn/Vanhanen IQ tests which you don't like---many of which tend to be the largest ones---and keep the ones you do. Or perhaps you're just suggesting we should bite the bullet and throw away ALL of the Lynn/Vanhanen data, and therefore base all our estimates of European IQs on "personal intuition." If that's not what you're saying, please do clarify.

Gladly. Lynn's IQ data are useful for picking out general trends that should be confirmed by more controlled studies. Unlike certain people, I don't ignore evidence that doesn't fit my preconceived ideas. I try to explain it as best I can, or I simply describe it as an unresolved problem.

As I said earlier, I view Lynn's work with some caution. This doesn't mean I reject it out of hand. Nor do I accept it uncritically. I do the sort of things that most academics do. I check the sources, I look at related studies by other authors, and I examine the data from as many angles as possible.


Ron Unz here:

Look, Peter. I don't claim to be an IQ expert. I'm just someone who looks at the data reported by the people who supposedly ARE IQ experts and then applies a little common sense and pattern-recognition.

Everyone seems to say that Lynn is one of the biggest IQ experts, and his book is filled with IQ studies.  Perhaps the ones with tiny sample sizes shouldn't be taken seriously, but the Irish and Polish ones are among the *largest* studies he reports.  If I can't believe any of his large IQ studies, or what he concluded from his years of personal research in Ireland, then maybe I should just throw away all his books and say that IQ obviously doesn't exist.

Well, you say I shouldn't trust any of Lynn's IQ studies.  Fine, so then I'll look at the Wordsum-IQ data from the GSS.  But then you say I shouldn't use Wordsum, because it's not really IQ, just (supposedly) has a 0.71 correlation with IQ.  Everyone else discussing IQ tends to use Wordsum as a rough proxy, but you say I shouldn't.

Okay, then maybe I'll use the international PISA results. Volkmar Weiss, who's supposedly another very big IQ expert, wrote a whole article in which he discussed PISA scores as useful proxies for IQ:

http://www.v-weiss.de/calibration.html

But you say I shouldn't use PISA.

So now I can't use Lynn's IQ studies, I can't use Wordsum in the U.S., and I can't use PISA worldwide.  Then what's left?  Suppose I ask you the simple question "What's the estimated IQ of Ireland?"---how would YOU figure out the answer...


Ron,

I would answer: "I don't know." I would also point out that none of the existing data on Irish IQ involve twin or adoption studies. All we have is data from classroom IQ tests and more distal sources like PISA. The existing evidence is nonetheless interesting and I would like to see more controlled studies done.

In any argument, there will always be weaker evidence and stronger evidence. A common debating tactic is to focus on the weaker evidence and create the impression that it is somehow central to the entire argument. With enough hand-waving, one might win the debate. This was, in fact, your line of attack in the American Conservative article:


Yet an objective review of the Lynn/Vanhanen data almost completely discredit the Lynn/Vanhanen "Strong IQ Hypothesis." If so many genetically-indistinguishable European populations—of roughly similar cultural and historical background and without severe nutritional difficulties—can display such huge variances in tested IQ across different decades and locations, we should be extremely cautious about assuming that other ethnic IQ differences are innate rather than environmental, especially since these may involve populations separated by far wider cultural or nutritional gaps.

In my opinion, this kind of debating strategy is unworthy of you. We're not here to engage in courtroom theatrics. We're here to find out the truth.

Reference

Unz, R. (2012). Race, IQ, and Wealth, The American Conservative, July 18. http://www.theamericanconservative.com/articles/race-iq-and-wealth/