Monday, September 26, 2022

Is intelligence all that matters for a successful society?


If we consider intelligence to be the only worthy mental attribute, we’ll end up with an elite that is not only intelligent but also narcissistic … and indifferent to the rest of us.


George Francis and Emil 
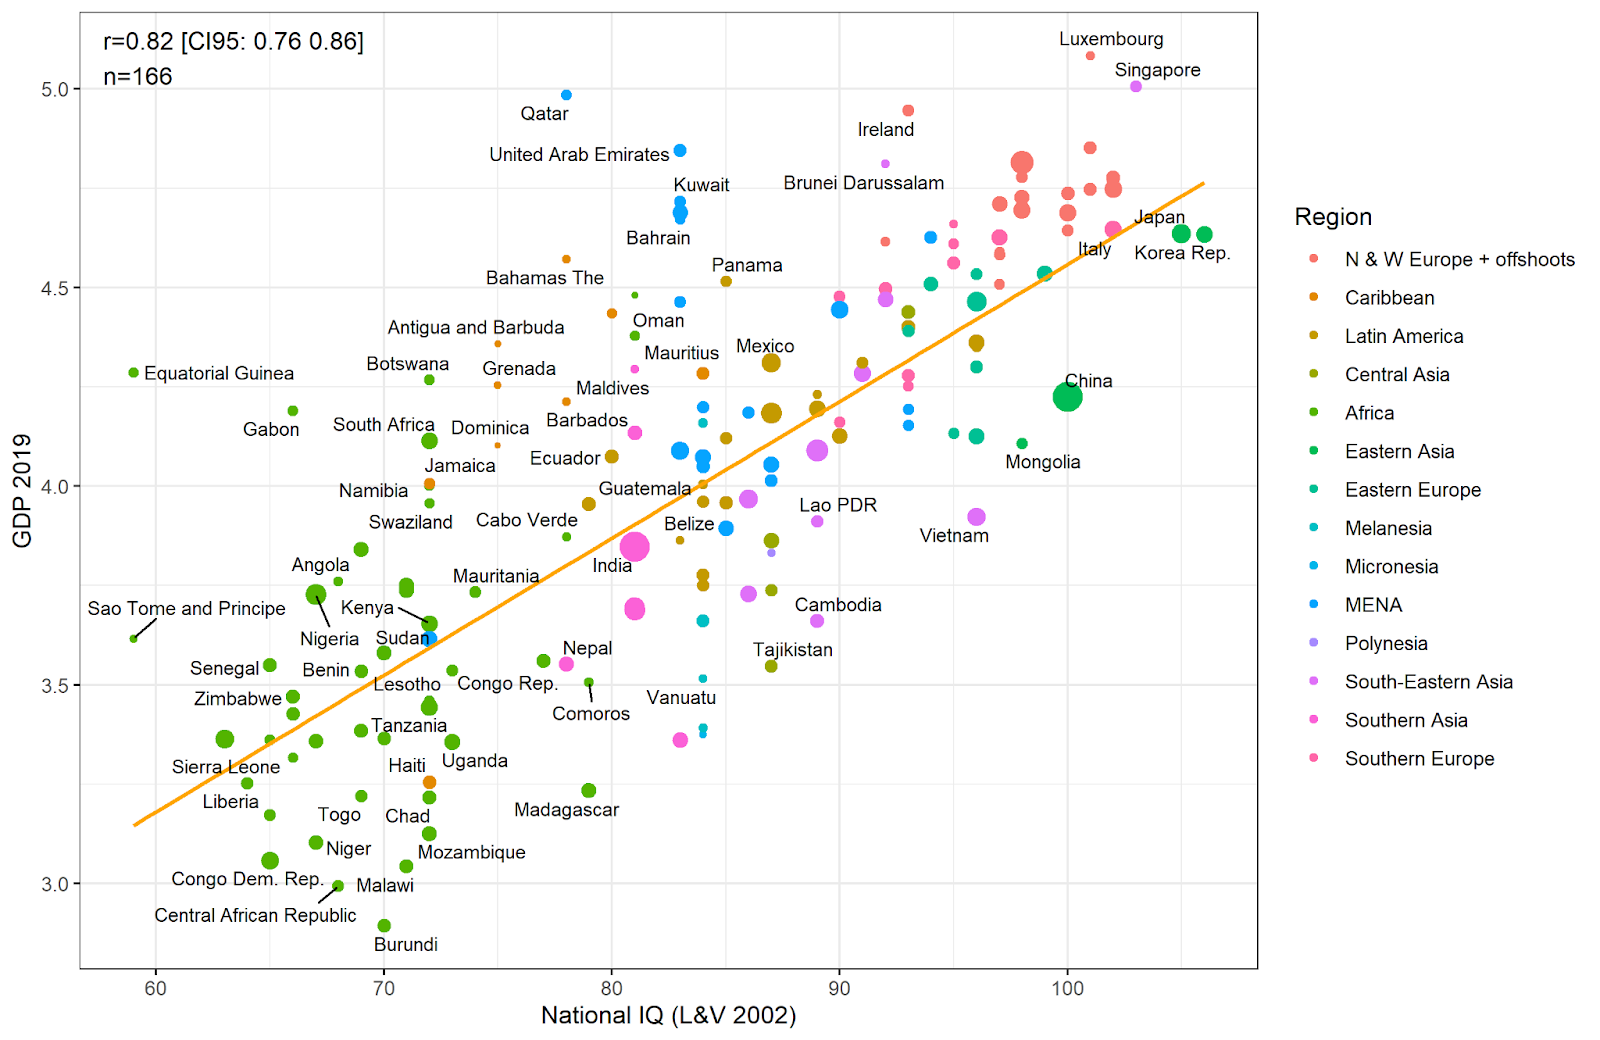
Kirkegaard have come out with a study that shows a strong correlation between IQ and wealth creation. The higher the mean IQ, the more a nation can create wealth:


We find national IQ to be the “best predictor” of economic growth, with a higher average coefficient and average posterior inclusion probability than all other tested variables (over 67) in every test run. Our best estimates find a one point increase in IQ is associated with a 7.8% increase in GDP per capita (Francis and Kirkegaard 2022)


The study is essentially an update of an earlier one by Richard Lynn and Tatu Vanhanen (2002). It’s better done, and I agree more or less with the conclusion. Wealth is not created in a vacuum. It’s created by flesh-and-blood humans who possess certain mental and behavioral attributes, one of which is high cognitive ability.


I do, however, have two criticisms.


Criticism #1: On a societal level, cognitive ability is confounded with other mental and behavioral attributes


Yes, high cognitive ability is important. But sustainable creation of wealth also requires other mental and behavioral attributes, notably:


·         propensity to identify social rules, obey them, and enforce them on others

·         feelings of guilt when one breaks the rules, even when there are no witnesses

·         empathy for others and a desire to understand how one’s behavior affects them

·         inhibition against using violence to settle disputes

·         high degree of future time orientation (also known as low time preference)


High IQ + high trust + low violence + low time preference = sustainable creation of wealth (Clark 2007; Clark 2009a; Clark 2009b; Frost 2020). Some will argue that intelligence goes hand in hand with high trust and low time preference (Carl 2014; Kirkegaard and Karlin 2020). That is true on a societal level: the same selection pressures that favor high intelligence usually favor the entire mental and behavioral package. On an individual level, however, intelligent sociopaths do exist, and they can prosper while others suffer. If they become too numerous or too influential, they will eventually destroy their host society. But that can take time.


In all fairness, Francis and Kirkegaard did investigate social trust and time preference. Unfortunately, those attributes are confounded with IQ: successful societies tend to have people who are not only intelligent but also trustworthy and future-oriented. That’s survivorship bias: if a society lacks the full mental and behavioral package, it usually goes extinct, and extinct societies get overlooked by cross-national studies. To be precise, societal extinction happens when the intelligent are unrestrained in their contempt for the less intelligent in their midst; they thus prey on them by any means possible, and the resulting strife leads to societal collapse.


IQ, social trust, and time preference are normally confounded with each other, at least in most existing societies. Therefore, if you control for IQ, the other two variables will go away, and you’ll think: “Aha! The key variable must be IQ!”


And you’ll feel all the more certain because IQ is not just equal to social trust or time preference in predicting wealth creation. It’s actually better! That greater predictive power, however, has a simple explanation: measurement of IQ is based on less subjective data. In this study, social trust is measured by self-report, and time preference is measured by an amalgam of survey responses and credit risk.


Criticism #2: The correlation is driven largely by unreliable African data


This study has another weak point: the correlation between wealth creation and IQ is driven largely by economic and cognitive data from Africa. If you remove Africa from the chart, the correlation becomes a lot weaker.


How reliable is the African data? Not very. First, a lot of African economic activity is “off the books.” That is particularly true for subsistence farming in the countryside, but it’s also true for many businesses in the towns and cities. GDP thus tends to be underestimated.


Second, even HBD writers disagree among themselves on mean African IQ, as pointed out by Heiner Rindermann:


The [cognitive] ability levels for Africans in Africa are the subject of strong disagreement. Rushton studied positively selected samples (South African university engineering students; Rushton, Skuy, & Fridjhon, 2003), but the mean differences between Africans and Europeans (14 IQ points) were similar to the ones found in Western countries. Lynn and Vanhanen (2006) estimated that sub-Saharan African countries had a mean IQ of 70. Wicherts, Dolan, and Maas (2010) using a different selection procedure came to a mean IQ of 82.


Rindermann’s “best guess” is 75. He concludes: “Given the quality of the data, it is not possible to come to a really precise result” (Rindermann 2013, p. 3). If we look at the chart from Lynn and Vanhanen (2002), we see that most sub-Saharan African countries are assigned mean IQs lower than 75. In fact, 75 seems to be the upper limit. That’s the IQ dataset of the new study.


Francis and Kirkegaard (2022, pp. 22-23) are aware that the IQ/GDP correlation is a lot weaker without the African IQ data, and they defend the validity of that dataset at some length. I’m still unimpressed, for two reasons:


·         If mean African IQ is 70, one must conclude that Africans are much less intelligent than African Americans, whose mean IQ is usually estimated at 85. Such a large difference cannot be explained by European admixture, heterosis, or nutrition.


·         The Yoruba of Nigeria have about the same polygenic score as that of African Americans (Piffer 2021, Fig. 7). Their mean IQ should therefore be 85. Yet, according to Lynn and Vanhanen, Nigerians have a mean IQ of 67. Since Nigeria is 18% Igbo, and since the Igbo show high academic achievement, mean Yoruba IQ should therefore be much less than the presumed Nigerian average of 67 (Chisala 2015; Frost 2022). The numbers don’t seem to add up.


Please don’t get me wrong. I agree that mean IQ is lower in Africa than in Eurasia, but the Lynn and Vanhanen estimates seem too low. In any case, they are not widely accepted even by researchers who accept that cognitive ability varies among human populations.


Similarly, I agree that more wealth is created per capita in Eurasia than in Africa. The difference, however, is overstated because so much of African GDP goes unreported. Furthermore, I don’t believe that lower IQ largely explains Africa’s economic underperformance. There is also the excessive use of violence to achieve one’s goals, both by the State and by private individuals. There is also the low level of trust that people have in each other—for the most part, Africans trust only their immediate family and friends. Finally, because family ties are so important, nepotism is widespread, and successful entrepreneurs end up being plundered by greedy relatives. The market economy cannot realize its full potential because the logic of the market has to compete with the logic of kinship.


Edit: George Francis has informed me that the correlation between IQ and GNP per capita remains unchanged if African cognitive and economic data are excluded. Without the African data, GDP per capita would increase 7.7% with each one point increase in IQ, rather than 7.8%.


Conclusion


Cognitive ability is only one of several mental and behavioral attributes that are key to building successful economies and societies. If we focus on it to the exclusion of others, we will be talked into supporting policies that have unintended consequences. A good example is the idea of reorienting immigration policy toward recruitment of high-IQ individuals.


That idea has the support of many conservatives throughout the West, but the consequences are very un-conservative. In short, we would be selecting immigrants who excel at creating wealth for themselves, by hook or by crook. The eventual result: an elite of rich narcissists who feel little sympathy for common people and who see them as objects to be used, when useful, and thrown away, when not.


Please don’t get bamboozled by reassurances that IQ correlates with trustworthiness and low time preference. That’s true only at the societal level. Those three attributes align with each other because they have to: otherwise, society would become dysfunctional and collapse. That’s survivorship bias: we get data from societies that have survived, and not from those that haven’t. If we cherry-pick high IQ immigrants from all over the world, we will create a new kind of society that has not stood the test of time.


Actually, that kind of society has arisen in the past:


And you should know that all the Cathayans [Chinese] detested the Grand Khan's rule because he set over them governors who were Tartars, or still more frequently Saracens, and these they could not endure, for they were treated by them just like slaves. You see the Great Khan had not succeeded to the dominion of Cathay [China] by hereditary right, but held it by conquest; and thus having no confidence in the natives, he put all authority into the hands of Tartars, Saracens, or Christians who were attached to his household and devoted to his service, and were foreigners in Cathay [China].

            The Travels of Marco Polo, Book 2, Chapter 23


Why do you think revolutions happen? It was precisely to avoid such a prospect that elite schools sought to develop not only intellect but also character, including the idea that the powerful have a duty to rule wisely and fairly. That view of higher education has given way to “meritocracy” throughout the West, with results that could have been predicted.


References


Carl, N. (2014). Does intelligence explain the association between generalized trust and economic development? Intelligence 47: 83-92. https://doi.org/10.1016/j.intell.2014.08.008


Chisala, C. (2015). The IQ gap is no longer a black and white issue. The Unz Review, June 25. http://www.unz.com/article/the-iq-gap-is-no-longer-a-black-and-white-issue/     


Clark, G. (2007). A Farewell to Alms. A Brief Economic History of the World. Princeton University Press: Princeton and Oxford.


Clark, G. (2009a). The indicted and the wealthy: surnames, reproductive success, genetic selection and social class in pre-industrial England.

http://www.econ.ucdavis.edu/faculty/gclark/Farewell%20to%20Alms/Clark%20-Surnames.pdf    


Clark, G. (2009b). The domestication of man: The social implications of Darwin. ArtefaCTos 2: 64-80. 

https://www.researchgate.net/publication/277275046_The_Domestication_of_Man_The_Social_Implications_of_Darwin  


Francis, G., and E.O.W. Kirkegaard. (2022). National Intelligence and Economic Growth: A Bayesian Update. The Mankind Quarterly 63(1). http://dx.doi.org/10.46469/mq.2022.63.1.2  


Frost, P. (2020). The large society problem in Northwest Europe and East Asia. Advances in Anthropology 10(3): 214-134. https://doi.org/10.4236/aa.2020.103012     


Frost, P. (2022). Recent cognitive evolution in West Africa: the Niger’s role. Evo and Proud, April 30. https://evoandproud.blogspot.com/2022/04/recent-cognitive-evolution-in-west.html  


Kirkegaard, E.O.W., and A. Karlin. (2020). National intelligence is more important for explaining country well-being than time preference and other measured non-cognitive traits. Mankind Quarterly 61: 339-370. http://doi.org/10.46469/mq.2020.61.2.11  


Lynn, R. and T. Vanhanen. (2002). IQ and the Wealth of Nations. Westport, Conn: Praeger


Piffer, D. (2021). Divergent selection on height and cognitive ability: evidence from Fst and polygenic scores. OpenPsych https://openpsych.net/files/submissions/14_Divergent_selection_on_height_and_cognitive_ability_evidence_from_Fst_and_13c3ICJ.pdf     


Rindermann, H. (2013). African cognitive ability: Research, results, divergences and recommendations. Personality and Individual Differences 55: 229-233. https://doi.org/10.1016/j.paid.2012.06.022     

Wednesday, September 14, 2022

The Great Decline


Mean polygenic score of Icelanders by year of birth (Kong et al. 2017, Fig. 2)


Three polygenic studies have shown that cognitive ability declined among European Americans, British people, and Icelanders during the 20th century. The decline briefly stopped during the postwar baby boom and again with the liberalization of abortion laws.


How can we measure the genetic component of cognitive ability? For a long time, the only way was to administer an IQ test, but the result would inevitably be influenced by the test-taker’s environment—not only culture and life history but also familiarity with taking tests and answering questions in rapid-fire succession. Yes, twin studies and adoption studies suggest that genetic factors largely explain variation in IQ between individuals. But the same is not necessarily true for variation in IQ between populations. That could be 100% environmental.


Recent years have seen the advent of a direct measure of innate cognitive ability: the educational attainment polygenic score. It’s a summation of the predicted effects of genetic variants that together explain 11-13% of the variance in educational attainment among individuals (Lee et al. 2018). It’s especially suited for predicting the mean IQ of a population—the correlation is 98% with the actual mean IQ (Piffer 2019).  Polygenic data predict a mean IQ of about 85 for sub-Saharan Africans, 100 for Europeans, and 105 for East Asians. There is also variation within each of those geographic groups. Among Europeans, predicted IQ varies from 97 for southern Europeans to 102 for Finns and 110 for Ashkenazi Jews. Among sub-Saharan Africans, it seems to be higher among groups who were more advanced during precolonial times, particularly those, like the Igbo, who lived along the Niger and took part in trade between the coast and the interior (Frost 2022).


The above predictions should be viewed with some caution. Because the genetic variants have been identified only in people of European descent, the polygenic score is less valid for non-Europeans, particularly those of sub-Saharan African descent. It thus predicts the IQ of African Americans with five times less accuracy than that of European Americans (Lasker et al. 2019).


Generational change


In addition to predicting differences in mean IQ across space, we can do the same across time. That begs the question: were past generations as intelligent as the latest one? We can answer that question by examining past generations who are still alive. That approach, however, raises the issue of survivorship bias: people who live to an old age are generally smarter than those who do not (Gottfredson and Deary 2004).


Beauchamp (2016) deals with this issue point by point when he discusses polygenic data from the Health and Retirement Study (HRS), a longitudinal study of 20,000 Americans shortly before and during retirement:


·         The HRS participants are people who have lived to the age of 50; however, about 10% of American women and 15% of American men born in 1940 were already dead by the age of 50.

·         Thus, in Beauchamp’s sample, 85% of the original participants were still alive in 2008, 69% were asked to be genotyped, and 59% consented to be genotyped.

·         Nonetheless, no important differences emerged when he compared the genotyped participants with the total sample. 


European Americans


Beauchamp found evidence that alleles associated with high educational attainment had declined in frequency among European Americans between the 1931 and 1953 birth cohorts. “[M]y results strongly suggest that genetic variants associated with EA have slowly been selected against among both female and male Americans of European ancestry born between 1931 and 1953.”


That decline is attributed to differences in fertility: “individuals with high EA typically have children at a more advanced age, which may further reduce their fitness.”


Icelanders


The above findings have been replicated by Kong et al. (2017) in their study of Icelanders born since 1910. Although survivorship bias is still a problem, it does not easily explain the decline in cognitive ability between the last two cohorts, i.e., Icelanders born in the 1970s and those born in the 1980s. In that decline, any survivorship bias would be due to deaths of people less than 44 years old, and in most cases less than 36 years old. “The samples studied here were collected between 1998 and 2014, with a majority (68%) ascertained before 2006” (Kong et al, 2017, p. E729).


Iceland’s cognitive decline had two “pauses”: one in the 1950s and another in the 1970s. The first pause coincides with the postwar economic boom and a corresponding improvement in the ability of middle class couples to start families early in life. The second pause may reflect the passage in 1975 of Iceland’s abortion law, which, while not allowing abortion on demand, did allow it for cases of rape, mental disability of the mother, and “difficult family situation” (Wikipedia 2022)


Kong et al. (2017) concluded that the cognitive decline was due only in part to more intelligent Icelanders staying in school longer and postponing reproduction. In fact, a high educational level, unlike a high polygenic score, was actually associated with somewhat higher fertility among males. A high polygenic score seems to reduce fertility independently of whether one pursues or does not pursue higher education, perhaps because higher intelligence goes hand in hand with greater ability to plan ahead and thus foresee, with trepidation, the costs of raising a family. 


British of European descent


In a study of British of European origin, using the UK Biobank, Hugh-Jones and Abdellaoui. (2022) found that mean cognitive ability had declined between two successive generations, particularly in lower-income groups. The median birth year was 1950 for the second generation and unknown for the first. The authors also looked at genetic variants that influence non-cognitive traits. In general, the bulk of the population seems to be getting dumber, fatter, and nuttier.


The authors nonetheless warn against excessive pessimism:


Many people would probably prefer to have high educational attainment, a low risk of ADHD and major depressive disorder, and a low risk of coronary artery disease, but natural selection is pushing against genes associated with these traits. Potentially, this could increase the health burden on modern populations, but that depends on effect sizes.


The authors go on to argue that the effect sizes are “small,” although one wonders: smaller than what? They then make the obvious point that generational change can accumulate from one generation to the next: “Although effects on our measured polygenic scores are small even after weighting, individually small disadvantages can cumulate to create larger effects” (Hugh-Jones and Abdellaoui 2022). Beauchamp (2016) makes a similar comment that seems reassuring on first thought, and then not so reassuring on second thought: “natural selection has thus been occurring in that population—albeit at a rate that pales in comparison with the rapid changes that have occurred in recent generations.”


Finally, Hugh-Jones and Abdellaoui (2022) point out that their data may suffer from ascertainment bias. For instance, the first generation of their dataset is composed of the parents of the second generation. The dataset thus excludes the childless individuals of the first generation. Were they more intelligent or less intelligent on average than the succeeding generation? Furthermore, participation in the UK Biobank is voluntary. Could that factor also be a source of bias? If so, in what direction?


Conclusion


As time goes by, intergenerational genetic datasets will become more complete, and the problem of survivorship bias will diminish. Ideally, we should conduct a “genetic census” of each generation, perhaps by collecting a DNA sample from everyone at the time of death. We will thus be able to see how we are evolving.


We now have intergenerational polygenic studies from three different Western countries: the U.S., the U.K., and Iceland. In all three cases, the genetic component of cognitive ability declined during the 20th century, with the exception of two pauses: one during the postwar baby boom and the other with the liberalization of access to abortion.


If we wish to halt the cognitive decline, we should push for the following measures:


·         A return to the protected high-wage economy that prevailed during the postwar era;

·         Free access to abortion, at least for cases of rape, mental disability of either parent, and difficult economic circumstances;

·         Pro-natalist measures to counteract the fear of not having the means to support a family. This fear is particularly strong among people who like to plan and are oriented toward the future.


References


Beauchamp, J.P. (2016). Genetic evidence for natural selection in humans in the contemporary United States. Proceedings of the National Academy of Sciences 113(28): 7774-7779. https://doi.org/10.1073/pnas.1600398113    


Frost, P. (2022). Recent cognitive evolution in West Africa: the Niger’s role. Evo and Proud, April 30. https://evoandproud.blogspot.com/2022/04/recent-cognitive-evolution-in-west.html  


Gottfredson, L. S., and I.J. Deary. (2004). Intelligence Predicts Health and Longevity, but Why? Current Directions in Psychological Science 13(1): 1–4. https://doi.org/10.1111/j.0963-7214.2004.01301001.x


Hugh-Jones, D., and A. Abdellaoui. (2022). Human Capital Mediates Natural Selection in Contemporary Humans. Behavior Genetics. https://doi.org/10.1007/s10519-022-10107-w  


Kong, A., M.L. Frigge, G. Thorleifsson, H. Stefansson, A.I. Young, F. Zink, G.A. Jonsdottir, A. Okbay, P. Sulem, G. Masson, D.F. Gudbjartsson, A. Helgason, G. Bjornsdottir, U. Thorsteinsdottir, and K. Stefansson. (2017). Selection against variants in the genome associated with educational attainment. Proceedings of the National Academy of Sciences 114(5): E727-E732. https://doi.org/10.1073/pnas.1612113114   


Lasker, J., B.J. Pesta, J.G.R. Fuerst, and E.O.W. Kirkegaard. (2019). Global ancestry and cognitive ability. Psych 1(1). https://doi.org/10.3390/psych1010034    


Lee, J. J., Wedow, R., Okbay, A., Kong, E., Maghzian, O., Zacher, et al. (2018). Gene discovery and polygenic prediction from a genome-wide association study of educational attainment in 1.1 million individuals. Nature Genetics 50(8): 1112-1121. https://doi.org/10.1038/s41588-018-0147-3  


Piffer, D. (2019). Evidence for Recent Polygenic Selection on Educational Attainment and Intelligence Inferred from Gwas Hits: A Replication of Previous Findings Using Recent Data. Psych 1(1): 55-75. https://www.mdpi.com/2624-8611/1/1/5   


Wikipedia (2022). Abortion in Iceland. https://en.wikipedia.org/wiki/Abortion_in_Iceland    


Monday, September 5, 2022

How real is the Flynn effect? Part II


Can you pass a Grade 8 exam that was given to American children in 1912? Why the Flynn effect never really happened.


My last post elicited a tweet from Elon Bachman:


Argument by incredulity (w.r.t. retardation) bedevils discussions of intelligence data. What's striking about most retards is the *congenital* speech & motor impairment, not the level of g. Height also increased 1 SD last century. There used to be a lot of malnourished peasants. @ElonBachman


In a population with an average IQ of 100, an IQ below 70 is usually due to abnormal circumstances, either freak accidents during pregnancy or rare mutations that haven’t been eliminated by natural selection. In either case, the adverse effects are wide-ranging and affect many aspects of mind and behavior. If your IQ is below 70, you’re lacking in much more than cognitive ability. You probably suffer from various speech and motor impairments. In short, you look and act “funny.”


A century ago, if we use current norming of IQ tests, average IQ was below 70 in the Western world. Yet it was not associated with looking and acting “funny.” How come?  For Elon Bachman, this is because an IQ of 70 was normal back then. It was not an outcome of freak accidents or rare mutations. The mental deficit was therefore confined to cognitive ability alone.


I understand that argument. Nonetheless, the increase in IQ between then and now is still 35 points—more than two standard deviations. Such a difference in cognitive ability should be visible in popular culture, particularly the books and newspapers that people read. It should also be visible in the academic requirements of elementary school, which was compulsory by that time in most North American jurisdictions.


The following are some questions from a Grade 8 exam that was given in 1912 to children in Bullitt County, Kentucky:


Find cost at 12½ cents per sq. yd. of kalsomining the walls of a room 20 ft. long, 16 ft. wide and 9 ft. high, deducting 1 door 8 ft. by 4 ft. 6 in. and 2 windows 5 ft. by 3 ft. 6 in. each.


A man sold a watch for $180 and lost 16 2/3%. What was the cost of the watch?


How many parts of speech are there? Define each.


What is a personal pronoun? Decline I.


Define longitude and latitude.


Tell what you know of the Gulf Stream.


Through what waters would a vessel pass in going from England through the Suez Canal to Manila?


Compare arteries and veins as to function. Where is the blood carried to be purified?


Define Cerebrum; Cerebellum.


Define the following forms of government: Democracy, Limited Monarchy, Absolute Monarchy, Republic. Give examples of each.


Name five county officers and the principal duties of each.


What is a copyright? Patent right?


Describe the Battle of Quebec.


Name the last battle of the Civil War; War of 1812; French and Indian War and the commanders in each battle.


Those are only a few of the questions. The full exam is here.


I understand why some want to believe that Western societies were much less intelligent a century ago. If we cannot use IQ to compare different populations over time, perhaps we cannot use it to compare different populations over space, i.e., in different parts of the world. And then what?


I’ve heard that sort of argument before. “If we accept genetic determinism for this, we may have to accept it for that. And then what?” If that’s your frame of mind, I have nothing more to say.


The increase in IQ and the increase in height during the 20th century


But what about the increase in height? That was real. If insufficient nutrition held back height during the 20th century, it should have also held back cognitive ability. The assumption here is that IQ and height are equally constrained by nutrition during development. Has that assumption been tested?


It has. The Dutch suffered a terrible famine during the winter of 1944-1945, as did much of continental Europe. Yet that famine had no discernable impact on the mental development of unborn children from that time:


A detailed retrospective study was made of 125,000 19-yr-old male Dutch military inductees of whom 20,000 were exposed to the Netherland's winter famine, 1944-1945, through maternal starvation. […] Findings show that (a) starvation during pregnancy had no detectable effects on adult mental performance of surviving male offspring. (b) Mental performance of surviving adult males from the entire population had no association with changing levels of mean birth weight in a hospital sample from the population. And (c) there was a strong association of social class with mental performance. (Stein et al. 1972)


It isn’t as if the Flynn effect didn’t occur in the Netherlands, As James Flynn points out:


As for nutrition, to my knowledge no one has actually shown that American or British or Western European children have a better diet today than they did in 1950, indeed, the critics of junk food argue that diets are worse. Yet, post-1950 IQ gains have been very large. Military samples tested in 1952, 1962, 1972, and 1982 show that Dutch males made a 20-point gain on a Raven’s-type test (Flynn, 1987, p. 172). Even the latest period shows a huge gain, that is, the Dutch 18-year olds tested in 1982 outscored the Dutch 18-year olds tested in 1972 by fully 8 IQ points. Did the quality of the Dutch diet really escalate that much in 10 years? The gains posted by the 1962 males over the 1952 males are interesting. (Flynn 2008)


Those 1962 males were born or still in the womb during the 1944-45 famine. Yet they “do not show up even as a blip in the pattern of Dutch IQ gains” (Flynn 2008). One could argue that the famine was too brief to affect cognitive ability. Perhaps malnutrition needs a longer time span to affect mental development. And again, what about the increase in height? What was driving that increase?


We don’t know for sure. We do know that height increased independently of the increase in IQ.


Norway was cited above as a nation in which the nutrition hypothesis is viable thanks to greater gains in the lower half of the IQ distribution. Actually, it counts against the posited connection between height gains and IQ gains. Height gains have been larger in the upper half of the height distribution than in the lower half (Sundet et al., 2004). This combination, greater height gains in the upper half of the distribution, greater IQ gains in the lower, poses a serious problem. Are there two kinds of enhanced nutrition, one of which raises height more than it does IQ, the other of which raises IQ more than it does height? (Flynn 2008)


There is no common cause behind the increase in IQ and the increase in height. The latter seems to be due to people eating a more varied diet after the Second World War. In particular, fewer and fewer people were subsisting largely on bread. That food item is problematic not only because it lacks many nutrients but also because it has a high content of phytic acid, which binds to calcium and other essential minerals in the food we eat (Harrison and Mellanby 1939; McCance and Widdowson 1942a; McCance and Widdowson 1942b; Sandstead 1992). With the postwar boom, and with efforts to educate people about the benefits of a balanced diet, bread made up a smaller and smaller proportion of total food intake. Bones could now fully develop.


Excessive consumption of bread, and the resulting lack of essential minerals, constrained skeletal development during the early 20th century. But it did not constrain cognitive ability.


References


Flynn, J.R. (2008). Requiem for nutrition as the cause of IQ gains: Raven's gains in Britain 1938-2008. Economics and Human Biology 7(1):18-27. https://doi.org/10.1016/j.ehb.2009.01.009


Harrison, D.C., and E. Mellanby. (1939). Phytic acid and the rickets-producing action of cereals. Biochemical Journal 33: 1660-1680. https://doi.org/10.1042%2Fbj0331660


McCance, R.A., and E.M. Widdowson. (1942a). Mineral metabolism of healthy adults on white and brown bread dietaries. The Journal of Physiology 101: 44-85. https://doi.org/10.1113%2Fjphysiol.1942.sp003967


McCance, R.A., and E.M. Widdowson. (1942b). Mineral metabolism on dephytinized bread. The Journal of Physiology 101: 304-313. https://doi.org/10.1113%2Fjphysiol.1942.sp003984


Sandstead, H.H. (1992). Fiber, phytates, and mineral nutrition. Nutrition Reviews 50: 30-31. https://doi.org/10.1111/j.1753-4887.1992.tb02464.x


Sieczkowksi, C. (2013). 1912 Eighth-Grade Exam Stumps 21st-Century Test Takers. Could You Pass This Eighth-Grade Exam from 1912? Huffpost, August 12. https://www.huffpost.com/entry/1912-eighth-grade-exam_n_3744163


Stein, Z., M. Susser, G. Saenger, and F. Marolla. (1972). Nutrition and mental performance. Science 178(4062): 708–713. https://doi.org/10.1126/science.178.4062.708


Sundet, J.M., D.G. Barlaug, and T.M. Torjussen. (2004). The end of the Flynn effect? A study of secular trends in mean intelligence test scores of Norwegian conscripts during half a century. Intelligence 32: 349– 362. https://doi.org/10.1016/j.intell.2004.06.004