Saturday, March 15, 2014

Did Europeans become white in historic times?


Tătăroaice – Petre Iorgulescu-Yor (source). Today, the steppes north of the Black Sea lie within the European world—politically, culturally, and demographically. Not so long ago, they were home to nomads of Central Asian origin.
 

A new study shows that Europeans underwent strong selection for white skin, non-brown eyes, and non-black hair … during historic times!

Here we present direct estimates of selection acting on functional alleles in three key genes known to be involved in human pigmentation pathways—HERC2, SLC45A2, and TYR—using allele frequency estimates from Eneolithic, Bronze Age, and modern Eastern European samples and forward simulations. Neutrality was overwhelmingly rejected for all alleles studied, with point estimates of selection ranging from around 2-10% per generation. Our results provide direct evidence that strong selection favoring lighter skin, hair, and eye pigmentation has been operating in European populations over the last 5,000 y. (Wilde et al., 2014) 
 
If true, this finding would contradict other recent findings. Two studies have found a much earlier time frame for the whitening of European skin: 11,000 to 19,000 years ago (Beleza et al., 2013) and 7,600 to 19,200 years ago (Canfield et al., 2014). Two studies of ancient DNA indicate that non-brown eyes were already in existence 7,000 years ago in Spain (Olalde et al., 2014) and 8,000 years ago in Luxembourg (Lazaridis et al., 2013). Moreover, the genes responsible are the same as the ones in above quote. 

So who is right and who is wrong? All of these studies are probably right, but only for some early Europeans and not for all. In the latest study, the samples come from a very small part of Europe—the steppes north of the Black Sea:2

Ancient DNA was retrieved from 63 out of 150 Eneolithic (ca. 6,500-5,000 y ago) and Bronze Age (ca. 5,000-4,000 y ago) samples from the Pontic-Caspian steppe, mainly from modern-day Ukraine. […] We also genotyped the three pigmentation-associated SNPs in a sample of 60 modern Ukrainians (28) and observed an increase in frequency of all derived alleles between the ancient and modern samples from the same geographic region (Table 1 and Fig. S1). This implies that the pigmentation of the prehistoric population is likely to have differed from that of modern humans living in the same area.

[…] Inferring natural selection based on temporal differences in allele frequency requires the assumption of population continuity. To this end we compared the 60 mtDNA HVR1 sequences obtained from our ancient sample to 246 homologous modern sequences (29–31) from the same geographic region and found low genetic differentiation (FST = 0.00551; P = 0.0663) (32). Coalescent simulations based on the mtDNA data, accommodating uncertainty in the ancient sample age, failed to reject population continuity under a wide range of assumed ancestral population size combinations. (Wilde et al., 2014)

The authors are placing the burden of proof on the wrong null hypothesis when they state that their simulations “failed to reject population continuity.” The null hypothesis should be population discontinuity. For example, Swedes and Greeks differ in skin tone and eye color, and if we compare their autosomal DNA we get a comparable FST of 0.0084 (Genetic History of Europe, 2014). Admittedly, FST is different with mitochondrial DNA.

I suspect the authors ruled out population discontinuity because their FST seemed incompatible with a non-European population giving way to a European one. If so, they forgot one thing. They were comparing a population of the present with one that existed some 5,000 years ago. If you go farther and farther back in time, any human population will look more and more ancestral to a present-day population. This is especially so in northern Eurasia, where a population ancestral to both Europeans and Amerindians existed some 20,000 years ago. Yes, the FST does seem incompatible with a non-European population giving way to a European one, but this is because the ancient DNA comes from a non-European population that was closer to the time of common origin for all northern Eurasians.

This ancient DNA may come from a mixed European/Central Asian population or an intermediate and now extinct population, perhaps similar to the Lapps. If we look at the derived (European) alleles for the three genes in question (HERC2, SLC45A2, TYR), the frequencies fall halfway between those of Europeans and Asians (see Table 1 in the paper). In any case, this population does not have to be of non-European origin to be noticeably darker in skin color. As shown by the recent Mesolithic findings from Luxembourg and Spain, there used to be apparently native dark-skinned populations in the heart of Europe.
 

Historical background 

The hypothesis of population discontinuity becomes even more plausible if we look at the history of this region. Today, the steppes north of the Black Sea lie within the European world—politically, culturally, and demographically. Not so long ago, they were home to nomads of Central Asian origin. The latest of them, the Tatars, held sway until the 18th century.

The Tatars intermixed extensively with Slavic wives and concubines, so much so that they now look almost as fair as other Europeans. But they were originally quite swarthy, as attested by medieval sources. In a 14th-century romance, The King of Tars, a Tatar Khan converts to Christianity and turns white in the baptismal water. Two other chronicles of the same period describe how a Tatar Khan's Christian concubine bears him a son white on one side and black on the other. When baptized, the child emerges from the water white on both sides (Hornstein, 1941; Metlitzki, 1977, p. 137).

Medieval writers often noticed this difference in skin color. Genoese notaries usually described Tatar slaves as olive-skinned (Plazolles Guillen, 2012, p. 119). Florentine acts of sale give the following numerical breakdown of Tatar slaves by skin color: black 2, brown 18, olive 161, fair 11, reddish 5, white 45 (Epstein, 2001, p. 108). During a trial, a slave tried to regain her freedom by claiming to be Russian and, hence, Christian. Her owner rebuked her, saying: “You’ve lied to me. You look more like a Tatar, not at all like a Russian” (Plazolles Guillen, 2012, p. 119).

The Tatars were preceded by other nomads of Central Asian origin. The Scythians (8th to 2nd century BC) were likewise described as dark-skinned. Hippocrates wrote: “The Scythian race are tawny from the cold, and not from the intense heat of the sun, for the whiteness of the skin is parched by the cold, and becomes tawny” (Hippocrates).

One can find references to the contrary (Scythians, 2014). Keep in mind that the word “Scythian” was often used in the ancient world to encompass all northern peoples:

To the ancient Greeks the Scythians, Sarmatians, Germans, and Goths were the remote northern races of antiquity. Geographically near to one another, they were often grouped together under the term “Scythians,” which by the third century B.C.E. no longer had an ethnic or national connotation and had come to designate the peoples of the remote north. (Goldenberg, 2003, p. 43)

The term “Scythian” may also have subsumed different peoples north of the Black Sea, some of whom came from Central Asia and others from areas farther north and west.
 

Conclusion

Because this region is on the periphery of the European world and has been exposed to migrations from Central Asia, population change is a likelier explanation for the findings of Wilde et al.

These findings are nonetheless interesting. Together with the ancient DNA from Mesolithic hunter-gathers in Spain and Luxembourg, we have further proof that many early Europeans were brown-skinned. Indeed, this seems to have been the physical appearance of all Europeans during their first 20,000 years in Europe. Only later, within the time frame of 20,000 to 10,000 years ago, did some of them become white.

This may seem surprising to those who believe that white skin is an adaptation to weak sunlight at high latitudes. It was thought that Europeans became white because their ancestors no longer needed dark pigmentation to protect themselves against sunburn and skin cancer. Meanwhile, light pigmentation became necessary to maintain synthesis of vitamin D. There was admittedly the example of dark-skinned peoples who have long lived at similar latitudes in Asia and North America, but that counterfactual was attributed to the availability of vitamin D from a marine diet, such as among the Inuit of northern Canada.
 
Wilkes et al. do, in fact, address the apparent contradiction between their findings and the hypothesis that ancestral Europeans became white to maintain adequate production of vitamin D in their skin. In their Discussion section, they suggest that the shift from hunting and gathering to farming led to a decrease in dietary vitamin D (from fatty fish and animal liver). The main problem with this explanation is that farming came late to many parts of Europe: about 2,000 to 3,000 years ago for East Baltic peoples and less than 3,000 years ago for Finnish peoples (and incompletely at that). This leaves a very narrow time frame for evolution from brown skin to white skin. Ultimately, this question will be resolved with retrieval of ancient DNA from these populations.

 
Notes

1. Although Wilde et al. mention hair color, they did not study the main hair-color gene, MC1R.

2. Razib Khan has a great map of the ancient DNA samples.
 

References 

Beleza, S., Murias dos Santos, A., McEvoy, B., Alves, I., Martinho, C., Cameron, E., Shriver, M.D., Parra E.J., and Rocha, J. (2013). The timing of pigmentation lightening in Europeans. Molecular Biology and Evolution, 30, 24-35.
http://mbe.oxfordjournals.org/content/30/1/24.short 

Canfield, V.A., A. Berg, S. Peckins, S.M. Wentzel, K.C. Ang, S. Oppenheimer, and K.C. Cheng. (2014). Molecular phylogeography of a human autosomal skin color locus under natural selection, G3, 3, 2059-2067.
http://www.g3journal.org/content/3/11/2059.full 

Epstein, S.A. (2001). Speaking of Slavery. Color, Ethnicity, & Human Bondage in Italy, Ithaca: Cornell University Press. 

Genetic History of Europe. (2014). Wikipedia
http://en.wikipedia.org/wiki/Genetic_history_of_Europe

Goldenberg, D.M. (2003). The Curse of Ham. Race and Slavery in early Judaism, Christianity, and Islam, Princeton: Princeton University Press. 

Hippocates. On Airs, Waters, and Places, part 20. Translated by Francis Adams
http://classics.mit.edu/Hippocrates/airwatpl.20.20.html

Hornstein, L.H.  (1941). New analogues to the King of Tars, Modern Language Review, 36, 433-442. 

Khan, R. (2014). Descent and selection is a bugger: Black Kurgans, March 12, The Unz Review: An Alternative Media Selection
http://www.unz.com/gnxp/descent-and-selection-is-a-bugger/ 

Lazaridis, I., Patterson, N., Mittnik, A., Renaud, G., Mallick, S., et al. (2013). Ancient human genomes suggest three ancestral populations for present-day Europeans, BioRxiv, December 23.
http://biorxiv.org/content/early/2013/12/23/001552.full-text.pdf+html

Metlitzki, D. (1977). The Matter of Araby in Medieval England, New Haven and London, Yale University Press. 

Olalde, I., M.E. Allentoft, F. Sanchez-Quinto, G. Saintpere, C.W.K. Chiang, et al. (2014).  Derived immune and ancestral pigmentation alleles in a 7,000-year-old Mesolithic European, Nature, early view
http://www.nature.com/nature/journal/vaop/ncurrent/full/nature12960.html

Plazolles Guillen, F. (2012). “Negre e de terra de negres infels …”: Servitude de la couleur (Valence, 1479-1516), in R. Botte and A. Stella (eds.) Couleurs de l’esclavage sur les deux rives de la Méditerranée (Moyen Âge – xxe siècle), pp. 113-158, Paris: Karthala. 

Scythians. (2014). Wikipedia
http://en.wikipedia.org/wiki/Scythians  

Wilde, S., A. Timpson, K. Kirsanow, E. Kaiser, M. Kayser, M. Unterländer, N. Hollfelder, I.D. Potekhina, W. Schier, M.G. Thomas, and J. Burger. (2014). Direct evidence for positive selection of skin, hair, and eye pigmentation in Europeans during the last 5,000 y, Proceedings of the National Academy of Sciences, published ahead of print.
http://www.pnas.org/content/early/2014/03/05/1316513111.full.pdf+html

Saturday, March 8, 2014

Population differences in intellectual capacity: a new polygenic analysis


PISA test documents at a German school (source: Theo Müller). PISA and IQ tests are informing us about differences in intellectual capacity by country. Meanwhile, genetic studies are informing us about genomic differences by country. Davide Piffer has been tapping into these two pools of data to explore the links between genes and intellectual capacity.
 

Between individuals and populations, intellectual capacity seems to differ through small differences at many genes. This is hardly surprising. Intelligence is a complex trait that involves many different genes interacting with each other and with the environment. If one gene changes, the immediate effect may be beneficial, but there will be side effects at other genes, and most of those side effects will likely be harmful. The bigger the effect at any one gene, the greater the likelihood of negative side effects elsewhere.

So evolution has proceeded through tinkering. A small effect here, a small effect there, but nothing that will rock the boat.

We must therefore pool data from many genes to understand the evolution of complex traits like intelligence. This is what Davide Piffer (2013) has done in a recent study. He began with seven genes (SNPs) whose different alleles are associated with differences in intellectual capacity, as measured by PISA or IQ tests. Then, for fifty human populations, he looked up the prevalences of the alleles that seem to increase intellectual capacity. Finally, for each population, he calculated their average prevalence at all seven genes.

The average prevalence was 39% among East Asians, 36% among Europeans, 32% among Amerindians, 24% among Melanesians and Papuan-New Guineans, and 16% among sub-Saharan Africans. The lowest scores were among San Bushmen (6%) and Mbuti Pygmies (5%). A related finding is that all but one of the alleles seem to be derived. In other words, they are specific to humans and not shared with ancestral primates.

Since these alleles have only small effects on intellectual capacity, there might be other causes for the above geographic pattern. For instance, as modern humans spread out of Africa, older alleles would have gradually given way to newer ones simply through founder effects and other random events. On the other hand, these derived alleles do not reach their highest prevalence in populations that are farthest removed from Africa, like the native inhabitants of the Americas and Oceania. The highest prevalences are actually reached less far away, in Europe and East Asia. Furthermore, the African/non-African difference is much greater for these alleles than for derived alleles in general. Derived alleles typically have a prevalence of 42% among sub-Saharan Africans and 56-57% among East Asians and Europeans (Watkins et al., 2001). This difference is tiny in comparison to the one for alleles that seem to increase intellectual capacity.
 

Principal component analysis

In this study and in a subsequent one (Piffer, 2014), principal component analysis has shown that a single factor explains much of the variability in the data (45%). Moreover, this one factor correlates highly with average IQ scores (r=0.9) and PISA scores (r=0.8) for each population. A common neural property thus seems to be the target of the various derived alleles. Could it be the elusive g factor?

The existence of such a large factor is further proof that we are dealing with some kind of selection pressure, and not random genetic changes like founder effects. It doesn’t follow, however, that the “unexplained variability” is without significance. Selection for intellectual capacity, like selection for any complex trait, may follow different paths in different cultural contexts. Moreover, there may be tradeoffs between different kinds of mental ability, and these tradeoffs may likewise vary according to the cultural context.
 

A final caveat

These seven genes are a small subset of the many genes that affect intellectual capacity. They thus provide only a rough picture of how this trait varies within the human species. Nonetheless, this picture is probably not far from reality. 
 

References

 
Piffer, D. (2013). Factor analysis of population allele frequencies as a simple, novel method of detecting signals of recent polygenic selection: The example of educational attainment and IQ, Interdisciplinary Bio Central, provisional manuscript
http://www.ibc7.org/article/journal_v.php?sid=312 

Piffer, D. (2014). Simple statistical tools to detect signals of recent polygenic selection, Interdisciplinary Bio Central, 6, article 1
http://www.ibc7.org/article/journal_v.php?sid=317

Watkins, W.S., C.E. Ricker, M.J. Bamshad, M.L. Carroll, S.V. Nguyen, M. A. Batzer, H.C. Harpending, A.R. Rogers, and L.B. Jorde. (2001). Patterns of ancestral human diversity: An analysis of Alu-insertion and restriction-site polymorphisms, American Journal of Human Genetics, 68, 738-752.

Saturday, March 1, 2014

The paradox of the Visual Word Form Area


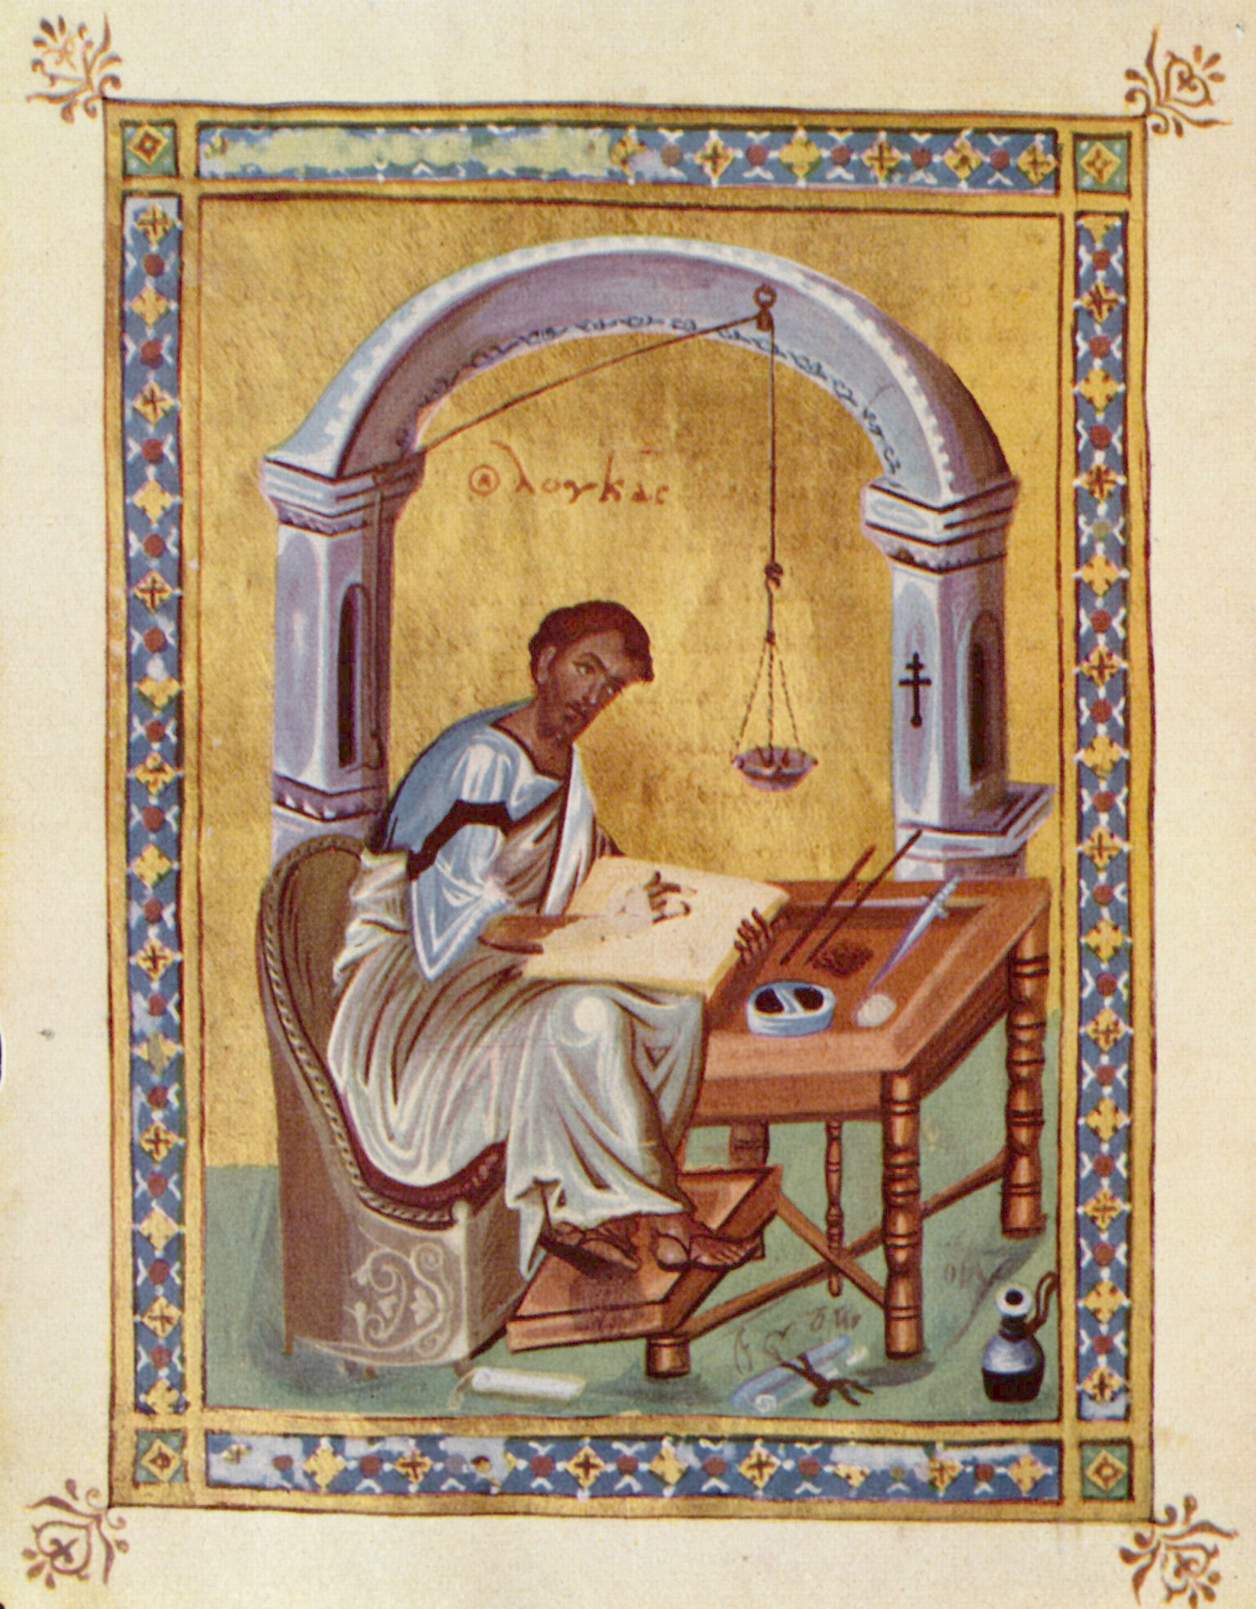
Luke the Evangelist (source: British Library). In the past, only a minority could read long texts of cursive writing. But many more could read short texts of block writing.
 

The Visual Word Form Area (VWFA) is a specialized part of the brain that helps us recognize written words and letters. If it is subjected to a surgical lesion, the patient will suffer a clear impairment to reading ability but not to recognition of objects, names, or faces or to general language abilities. There will be some improvement over the next six months, but reading will still take twice as long as it had before surgery (Gaillard et al, 2006).

Most of the initial skepticism over the existence of the VWFA has disappeared. There does seem to be, however, much variability in its size. An area that may fall within this mental organ in one person may fall outside it in someone else (Glezer and Riesenhuber, 2013).

In addition to word recognition, the VWFA may participate in higher-level processing of word meaning:

[It seems that] the VWFA would not only be recruited at an early stage for allowing low-level (script processing) word processing as has been previously instantiated (Pammer et al., 2004; Dehaene and Cohen, 2011), but also at a later stage for gating high-level (lexico-semantic) processing. Such late semantic gateway would not be selective to the VWFA but rather emerge in the posterior LOT and extend anteriorly to the VWFA. (Levy et al., 2013)

The VWFA is described in the above study as a “bottleneck to consciousness.” It helps us not only to recognize words on a page but also to understand what the words mean. To me, this makes sense. I’m better at thinking through an idea and its implications if I can write it down and then read it. There thus seems to be a single mental pathway that does double duty: processing character strings (words) and processing higher-level concepts.

 
Population differences 

The VWFA functions differently in different human populations. The difference is striking between people who use alphabetical script, where each symbol represents a sound, and those who use logographic script, where each symbol represents an idea. Chinese subjects process their idea-based symbols with assistance from other brain regions, whereas Westerners process their sound-based symbols only in the VWFA (Liu et al., 2008). Similarly, dyslexics activate this brain region in ways that differ by linguistic background, apparently because of differences in spelling and writing (Paulesu et al., 2001).


Hardwired or softwired?

For Dehaene and Cohen (2011), the VWFA is not a hardwired mental organ. They argue that it occupies the same area of the brain because that is where we can most easily recruit neurons when learning to recognize words. But why, then, does this recruitment happen so fast in young children? When kindergarten children were asked to play a grapheme/phoneme correspondence game, their VWFAs preferentially responded to pictures of letter strings after a total of 3.6 hours over an 8-week period. It is worth noting that only a few of these children could actually read, and even then only at a rudimentary level (Brem et al., 2010; Dehaene et al., 2010).

But the alternative view, hardwiring, is also hard to accept. Reading began not in the Paleolithic but in historic times, less than 6,000 years ago. Widespread literacy is even more recent, and there are still many societies where most people cannot read or write. How could an entirely new mental organ have evolved over so short a time?

Yet this alternative view may not be so farfetched. Let’s examine the two main objections.


Was there not enough time for natural selection to work?

The VWFA did not evolve out of nothing. It seems to be a population of neurons that originally served to recognize faces (Dehaene and Cohen, 2011). This sort of recycling is a common pathway for natural selection and explains much of the apparent rapidity of evolution. A complex mental adaptation may take a long time to evolve, but much less time is needed to develop an exaggerated version of it or to alter when and how it becomes activated (Harpending and Cochran, 2002).

Indeed, parallel to the way alphabetical reading ability has spread historically and geographically, there is a similar spread of the latest variant of ASPM, a gene implicated in the regulation of brain growth. In humans, a new variant arose about 6,000 years ago in the Middle East. It eventually became more prevalent in the Middle East (37-52% incidence) and Europe (38-50%) than in East Asia (0-25%) (Frost, 2011; Mekel-Bobrov et al., 2005). 


Would it have benefited too few people to have been favored by natural selection?

There is some debate over the relative recentness of literacy. It is true that before the modern era only a small minority could read long texts of cursive writing. But the ability to read short texts of block writing was much more widespread, as evidenced by the prevalence of graffiti and storefront signs. We should also keep in mind that the literate few contributed disproportionately to the gene pool of subsequent generations. Clark (2007) has shown that the English lower class is largely descended from people who were middle or upper class a few centuries ago. In the ancient world, there was a perception that scribes enjoyed reproductive success. The Book of Sirach [39: 11] states: “If [a scribe] lives long, he will leave a name greater than a thousand.” 


Gene-culture co-evolution?

There may have been positive feedback between reading ability and the cultural opportunities it created. One example is the scientific revolution in Western Europe (15th - 18th centuries), which took off once a critical mass of scholars could read each other’s papers. In short, reading and writing are advantageous to the extent that other people can read and write. While this kind of feedback loop is self-evident, its biological implications may be less so. The same feedback loop would have steadily ratcheted up selection for the VWFA and, subsequently, for higher-level faculties. This might explain why the VWFA evolved beyond word recognition per se and towards lexico-semantic tasks.


Future research

One priority would be to study the VWFA in populations that have become literate only in recent times. What form, if any, does it take in such people? A study in New York elementary schools found that VWFA activation varied with socioeconomic status. In students from high SES families, activation seemed to be more hardwired and less dependent on familiarity with the way sounds are visually represented. Unfortunately, there was no attempt to break the data down by ethnic background (Noble et al., 2006).

At present, high VWFA activation is attributed to an environment where reading material is accessible and parents very supportive, this being in turn attributed to high SES. Yet reading material is ubiquitous nowadays. And how crucial is parental support? As a child, I read almost always on my own with little encouragement at home or school. My teachers were in fact annoyed by my habit of sneaking into the small storage room where old textbooks and encyclopedias were kept (we had no library). “If you’ve finished your assignment, stay at your desk. Is that clear?!”

Nonetheless, I read voraciously, even when I couldn’t understand half of what I read. Strange new words were a source of pleasure, and I would often read and reread the same texts simply because I liked the flow of the words and the images they conjured up.
 

References 

Brem, S., S. Bach, K. Kucian, T.K. Guttorm, E. Martin, H. Lyytinen, D. Brandeis, and U. Richardson. (2010). Brain sensitivity to print emerges when children learn letter-speech sound correspondences, Proceedings of the National Academy of Sciences U.S.A., 107, 7939–7944.
http://psyserv06.psy.sbg.ac.at:5916/fetch/PDF/20395549.pdf

Clark, G. (2007). A Farewell to Alms. A Brief Economic History of the World, Princeton University Press, Princeton and Oxford.

Dehaene, S. and L. Cohen. (2011). The unique role of the visual word form area in reading, Trends in Cognitive Sciences, 15, 254-262.
http://www.cnbc.pitt.edu/~plaut/VisCog/papers/DehaeneCohen11TICS.VWFA.pdf  

Dehaene, S. et al. (2010). How learning to read changes the cortical networks for vision and language, Science, 330, 1359–1364.
http://gondabrain.ls.biu.ac.il/Neuroling/courses/877/Dehaene_Science2010.pdf

Frost, P. (2011). Human nature or human natures? Futures, 43, 740-748.
http://dx.doi.org/10.1016/j.futures.2011.05.017  

Gaillard, R., Naccache, L., P. Pinel, S. Clémenceau, E. Volle, D. Hasboun, S. Dupont, M. Baulac, S. Dehaene, C. Adam, and L. Cohen. (2006). Direct intracranial, fMRI, and lesion evidence for the causal role of left inferotemporal cortex in reading, Neuron, 50, 191-204.
http://citeseerx.ist.psu.edu/viewdoc/download?doi=10.1.1.76.7620&rep=rep1&type=pdf

 
Glezer, L.S. and M. Riesenhuber. (2013). Individual variability in location impacts orthographic selectivity in the “Visual Word Form Area”, The Journal of Neuroscience, 33(27), 11221–11226.
http://www.jneurosci.org/content/33/27/11221.full  

Harpending, H., and G. Cochran. (2002). In our genes, Proceedings of the National Academy of Sciences USA, 99(1), 10-12.
http://www.wcas.northwestern.edu/nescan/2008-2009%20papers/harpending%20-%20in%20our%20genes.pdf  

Levy, J., J.R Vidal, R. Oostenveld, I. FitzPatrick, J-F. Démonet, and P. Fries. (2013). Alpha-band suppression in the Visual Word Form Area as a functional bottleneck to consciousness, NeuroImage,78C, 33-45.
http://hal.inria.fr/docs/00/81/96/67/PDF/Levy_et_al.pdf  

Liu, C., W-T. Zhang, Y-Y Tang, X-Q. Mai, H-C. Chen, T. Tardif, and Y-J. Luo. (2008). The visual word form area: evidence from an fMRI study of implicit processing of Chinese characters, NeuroImage, 40, 1350-1361.
http://psychbrain.bnu.edu.cn/teachcms/res_base/teachcms/upload/channel/file/2010_4/11_25/6hlcggx7rk3z.pdf  
Mekel-Bobrov, N., S.L. Gilbert, P.D. Evans, E.J. Vallender, J.R. Anderson, R.R. Hudson, S.A. Tishkoff, and B.T. Lahn. (2005). Ongoing adaptive evolution of ASPM, a brain size determinant in Homo sapiens, Science, 309, 1720-1722.
http://ftp.eebweb.arizona.edu/faculty/nachman/Archived%20Research%20Papers/mekel_bobrov_et_al_2005.pdf  

Noble, K.G., M.E. Wolmetz, L.G. Ochs, M.J. Farah, and B.D. McCandliss. (2006). Brain–behavior relationships in reading acquisition are modulated by socioeconomic factors, Developmental Science, 9, 642–654.
http://www.cumc.columbia.edu/dept/sergievsky/fs/publications/Noble-et-al-2006-2.pdf  

Paulesu E., J.F. Démonet, F. Fazio, E. McCrory, V. Chanoine, N. Brunswick et al (2001). Dyslexia: cultural diversity and biological unity, Science, 291, 2165–2167.
http://www.drru-research.org/data/resources/42/Paulesu-et-al-2001.pdf

Saturday, February 22, 2014

Replacement or continuity?


Inuit meat cache, Kazan River (source: Library and Archives Canada / PA-101294). Because of their high meat diet, hunters produce more body heat than farmers do. Natural selection has thus favored certain mtDNA sequences over others in humans with this profile of heat production. A change in selection pressure may therefore explain, at least in part, the genetic divide between late hunter-gatherers and early farmers in Europe.
 

Who were the ancestors of present-day Europeans? The hunter-gatherers of the Paleolithic and the Mesolithic? Or the Neolithic farmers who began to spread out of the Middle East some 10,000 years ago?

This debate has teetered back and forth for the past thirty years. On the basis of various genetic polymorphisms, L.L. Cavalli-Sforza and his students argued that Europeans are largely descended from Middle Eastern farmers (Ammerman and Cavalli-Sforza, 1984; Cavalli-Sforza et al., 1994). On the basis of mtDNA and Y chromosomal data, two other research teams, one led by Martin Richards and the other by Ornella Semino, maintained that the European gene pool is over 75% of native hunter-gatherer origin (Richards et al., 2000; Semino et al., 2000). If we look only at the present-day gene pool, Europeans seem far too differentiated to be the descendants of Neolithic farmers from the Middle East.

Over the last few years, new evidence has swung the debate back to the model of population replacement. By retrieving DNA from ancient skeletal remains, we can now compare the latest hunter-gatherers with the earliest farmers, and what we see is a sharp genetic divide between the two (Bramanti et al., 2009). The farmers seem to have been immigrants who replaced the hunter-gatherers. This is direct evidence, so what more is there to say? Facts are facts.

Yet there is always more to say. Facts may be illusory or, if real, wrongly interpreted. For one thing, wherever we have a fairly continuous time series of ancient DNA, the genetic divide no longer appears between the latest hunter-gatherers and the earliest farmers. It appears between the earliest farmers and somewhat later farmers. This is particularly so when we examine haplogroup U lineages, whose disappearance is widely seen as evidence for population replacement. According to a study of 92 Danish remains, these lineages remained common after the Neolithic and reached their current low prevalence only during the Early Iron Age (Melchior et al., 2010).

If this genetic divide is not solely due to population replacement, what else might be responsible? Mishmar et al. (2003) were the first to suggest natural selection:

Thus, extensive global population studies have shown that there are striking differences in the nature of the mtDNAs found in different geographic regions. Previously, these marked differences in mtDNA haplogroup distribution were attributed to founder effects, specifically the colonizing of new geographic regions by only a few immigrants that contributed a limited number of mtDNAs. However, this model is difficult to reconcile with the fact that northeastern Africa harbors all of the African-specific mtDNA lineages as well as the progenitors of the Eurasia radiation, yet only two mtDNA lineages (macrohaplogroups M and N) left northeastern Africa to colonize all of Eurasia (1, 2) and also that there is a striking discontinuity in the frequency of haplogroups A, C, D, and G between central Asia and Siberia, regions that are contiguous over thousands of kilometers. Rather than Eurasia and Siberia being colonized by a limited number of founders, it seems more likely that environmental factors enriched for certain mtDNA lineages as humans moved to the more northern latitudes.

[...] We now hypothesize that natural selection may have influenced the regional differences between mtDNA lineages. This hypothesis is supported by our demonstration of striking differences in the ratio of nonsynonymous (nsyn)/synonymous (syn) nucleotide changes in mtDNA genes between geographic regions in different latitudes. We speculate that these differences may reflect the ancient adaptation of our ancestors to increasingly colder climates as Homo sapiens migrated out of Africa and into Europe and northeastern Asia.

This hypothesis has since received support from Balloux et al. (2009):

We show that populations living in colder environments have lower mitochondrial diversity and that the genetic differentiation between pairs of populations correlates with difference in temperature. These associations were unique to mtDNA; we could not find a similar pattern in any other genetic marker. We were able to identify two correlated non-synonymous point mutations in the ND3 and ATP6 genes characterized by a clear association with temperature, which appear to be plausible targets of natural selection producing the association with climate. The same mutations have been previously shown to be associated with variation in mitochondrial pH and calcium dynamics. Our results indicate that natural selection mediated by climate has contributed to shape the current distribution of mtDNA sequences in humans.

Humans have to adapt to two sources of warmth: climate and internal body heat, which in turn varies with lifestyle and diet. Diet in particular results in different patterns of body heat production between hunter-gatherers and farmers, as explained by Speth (1983):

One aspect of protein metabolism relevant to this issue concerns the high "specific dynamic action" (SDA) of protein ingestion. The SDA of food refers to the rise in metabolism or heat production (diet-induced thermogenesis) resulting from the ingestion of food [...] The SDA of a diet consisting largely of fat is about 6- 14%, while that of a diet high in carbohydrates is about 6%. In striking contrast, the SDA of a diet consisting almost entirely of protein may be as high as 30%; or, in other words, for every 100 calories of protein ingested, up to 30 calories are needed to compensate for the increase in metabolism. Thus, persons whose diets are high in protein experience higher metabolic rates than those whose diets are composed largely of carbohydrate. For example, members of Eskimo populations, at least 90% of whose caloric needs were traditionally met by meat and fat (cf. Draper 1980:263; Hoygaard 1941), had basal metabolic rates 13 to 33% above the DuBois standard, which is based on the metabolic rates of populations consuming western diets (Itoh 1980:285).

Conclusion

Before ancient DNA became available, the prehistory of populations had to be inferred. The age of a genetic lineage was inferred from the degree of differentiation divided by the mutation rate. Since both variables could be known only approximately, the time depths of Europe's genetic lineages were likewise known only approximately.

Ancient DNA seems to promise a clearer picture because the only source of uncertainty is the age of the skeletal material. Unfortunately, this new method is more sensitive to uncertainty from another source: natural selection. Late hunter-gatherers and early farmers had to adapt to different environments. There certainly was a genetic divide between the two, but did it result from differences in origin or from differences in natural selection?

Natural selection distorts the picture if either method is used, since both assume that mtDNA is selectively neutral. The distortion is more serious, however, with the new method, which assumes selective neutrality across the genetic divide between late hunter-gatherers and early farmers—the very moment in prehistory when this assumption is most likely to fail. The old method assumes selective neutrality throughout the entire time depth of Europe’s genetic lineages—an assumption that may indeed be true over most of that time.

Even if the lineage has no selective value in and of itself, natural selection can still distort the picture. This is especially so for mtDNA:

Selection can change allele frequency even at a locus not responsible for fitness differences. Because there is little or no recombination in mitochondrial DNA, selection at one nucleotide affects the frequencies of all other variable nucleotides for the whole molecule. Selection on the nuclear genome, particularly nuclear-encoded proteins that are imported into the mitochondrion and X-linked markers that can have a high effective linkage to mtDNA, can also cause changes in the frequencies of mtDNA haplotypes. Equally importantly, selection on any other cytoplasmically inherited traits will directly affect the frequencies of mtDNA. (Ballard and Whitlock, 2004)

This is less of a problem with nuclear DNA because of recombination, but the problem remains if the presumably neutral gene is close to another gene of high selective value.

In raising these points, I am not trying to argue that Middle Eastern farmers made no contribution to the European gene pool. There is good archaeological evidence of these farmers pushing up the Danube and into central Europe. Elsewhere, however, the evidence for population replacement becomes weaker and the evidence for continuity correspondingly stronger. This is the conclusion that Zvelebil and Dolukhanov (1991) make with respect to northern and eastern Europe:

The transition to farming occurred very slowly and took a long time to complete, the whole process lasting 1500-4000 years. In the far north and northeast of Europe, the process was never completed. [...] Local hunter-gatherer societies played a significant role in the transition. There is strong evidence for continuity in material culture in most regions throughout the transition. Although this neither proves nor disproves the case for population movement associated with the transition (small groups of people could have migrated, leaving little or no trace in the archaeological record), such evidence does not support the colonization model for the transition to farming and it does indicate that local hunter-gatherer traditions were passed on from generation to generation during the long period of the adoption of farming.

And yet the advent of farming brought massive genetic change to northern and eastern Europe, including widespread decline of haplogroup U—the sort of change that is supposed to mean massive population replacement. Since farming began to spread to this region only 6,000 years ago, even later among the Finnish and Baltic peoples, there is only a very narrow time frame in which northern and eastern Europeans could have evolved their characteristic physical appearance, assuming of course that population replacement had actually happened.

Even in central Europe, where population replacement is well documented, we are still unsure whether it was permanent or temporary. Indeed, we see evidence of the replacers being later replaced, perhaps by natives who had never disappeared from the vicinity of the farming settlements (Haak et al., 2005; Rowley-Conwy, 2011).
 

References

Ammerman, A.J. and L.L. Cavalli-Sforza. (1984). The Neolithic Transition and the Genetics of Populations in Europe, New Jersey: Princeton University Press.

Ballard, J.W.O. and M.C. Whitlock. (2004). The incomplete natural history of mitochondria, Molecular Ecology, 13, 729-744.
http://dna.ac/filogeografia/PDFs/Ballard%26Whitlock_04_MTrev.pdf

Balloux F., L.J. Handley, T. Jombart, H. Liu, and A. Manica (2009). Climate shaped the worldwide distribution of human mitochondrial DNA sequence variation. Proceedings. Biological Sciences, 276 (1672), 3447-55.
http://www.ncbi.nlm.nih.gov/pmc/articles/PMC2817182/?tool=pmcentrez

Bramanti, B., M. G. Thomas, W. Haak, M. Unterlaender, P. Jores, K. Tambets, I. Antanaitis-Jacobs, M.N. Haidle, R. Jankauskas, C.-J. Kind, F. Lueth, T. Terberger, J. Hiller, S. Matsumura, P. Forster, and J. Burger. (2009). Genetic discontinuity between local hunter-gatherers and Central Europe's first farmers, Science, 326 (5949), 137-140.
http://jsarf.free.fr/palanthsci/Europe's%20First%20Farmers%20Were%20Immigrants.pdf

Cavalli-Sforza, L.L., P. Menozzi, and A. Piazza. (1994). The History and Geography of Human Genes, New Jersey: Princeton University Press.

Haak, W., P. Forster, B. Bramanti, S. Matsumura, G. Brandt, M. Tänzer, R. Villems, C. Renfrew, D. Gronenborn, K.W. Alt, and J. Burger. (2005). Ancient DNA from the first European farmers in 7500-year-old Neolithic sites, Science, 310 (5750), 1016-1018.
http://www.sciencemag.org/content/310/5750/1016.short

Melchior, L., N. Lynnerup, H.R. Siegismund, T. Kivisild, J. Dissing. (2010). Genetic diversity among ancient Nordic populations, PLoS ONE, 5(7): e11898
http://www.plosone.org/article/info%3Adoi%2F10.1371%2Fjournal.pone.0011898#pone-0011898-g002

Mishmar, D., E. Ruiz-Pesini, P. Golik, V. Macaulay, A.G. Clark, S. Hosseini, M. Brandon, K. Easley, E. Chen, M.D. Brown, R.I. Sukernik, A. Olckers, and D.C. Wallace. (2003). Natural selection shaped regional mtDNA variation in humans, Proceedings of the National Academy of Sciences (USA), 100 (1), 171-176.
http://www.pnas.org/content/100/1/171.full

Richards, M., V. Macaulay, E. Hickey, E. Vega, B. Sykes, et al. (2000). Tracing European founder lineages in the Near Eastern mtDNA pool, American Journal of Human Genetics, 67, 1251-1276.
http://www.sciencedirect.com/science/article/pii/S0002929707629541

Rowley-Conwy, P. (2011). Westward ho! The spread of agriculturalism from Central Europe to the Atlantic, Current Anthropology, 52 (S4), S431-S451.
http://arkeobotanika.pbworks.com/w/file/fetch/48307263/Rowley-Conwy%2011%20CA%20Farming%20westward.pdf

Semino, O., G. Passarino, P.J. Oefner, A.A. Lin, S. Arbuzova, et al. (2000). The genetic legacy of Paleolithic Homo sapiens sapiens in extant Europeans: A Y chromosome perspective, Science, 290, 1155-1159.
http://fboekelo.tripod.com/boekelo/GP/semino.pdf

Speth, J.D. (1983). Energy source, protein metabolism, and hunter-gatherer subsistence strategies, Journal of Anthropological Archaeology, 2, 1-31.
http://faculty.ksu.edu.sa/archaeology/Publications/Hearths/Energy%20source,%20protein%20metabolism,%20and%20hunter-gatherer%20subsistence%20strategies.pdf

Zvelebil, M. and P. Dolukhanov. (1991). The transition to farming in Eastern and Northern Europe, Journal of World Prehistory, 5, 233-278.
http://link.springer.com/article/10.1007/BF00974991

Saturday, February 15, 2014

Burakumin, Paekchong, and Cagots

This is the first of a series of ebooks. You can access an Epub version here or a PDF here. Below is the foreword.

----------------------------------------------------------------------------------------

Foreword

 
The Burakumin of Japan, the Paekchong of Korea, and the Cagots of France … What do they have in common? All three were despised castes—closed groups of people who married among themselves. A despised caste is not just a low class. Otherwise, it would always be gaining and losing members, with some moving up and out and others down and in. As Gregory Clark has shown, the English lower class is descended largely from people who were middle or even upper class a few centuries before. This may seem strange if you equate the middle class with voluntary childlessness, but until the late 19th century they were the ones who had the most children—even more so if we look only at children who lived to adulthood. The resulting demographic overflow continually spilled over into the lower class.

In contrast, not much new blood flows into a despised caste, at least not on an ongoing basis. Social stigma discourages people from marrying out or marrying in. Nor does one enter simply by virtue of being poor, since the fear of losing caste keeps out most of the downwardly mobile. Despite this lack of new blood, a despised caste can perpetuate itself indefinitely because its members usually have enough resources—through their monopoly over equally despised occupations—to get married, form families, and have enough children to replace themselves. This was not the case with urban lower classes of pre-industrial times, which typically had large numbers of childless single men.

Because a caste is closed and self-perpetuating, it may preserve genetic traits that disappear everywhere else. It thus becomes more and more different not because it is changing but because its host population is changing.

But how can a population change over a few centuries? Didn’t human nature assume its present form back in the Pleistocene when cultural evolution took over from genetic evolution? In reality, these two evolutionary processes have reinforced each other. Human genetic evolution actually accelerated 40,000 years ago and even more so 10,000 years ago, apparently in response to a growing diversity of cultural environments.

What about Richard Lewontin’s finding that human genes vary much more within populations than between populations? Isn’t that proof that genetic evolution stagnated while humans were spreading over the earth and forming the many populations we see today? Lewontin’s finding is correct but does not mean what it seems to mean. Indeed, the same genetic overlap has been found between many species that are nonetheless distinct anatomically, morphologically, and behaviorally. Genetic variation between populations differs qualitatively from genetic variation within populations. In the first case, genes vary across a boundary that separates different environments and, thus, different selection pressures. This kind of genetic variation is shaped by selection and gives rise to real phenotypic differences. The situation is something else entirely when genes vary among individuals who belong to the same population and face similar selection pressures. That kind of variation matters much less, the actual phenotypic differences often being trivial or nonexistent.

Human evolution is a logarithmic curve where most of the interesting changes have happened since the advent of farming and complex societies. Homo sapiens was not a culmination but rather a beginning … of gene-culture co-evolution. There are many ways to study this co-evolution, but one way is to look at the different evolutionary trajectories followed by castes and their host populations.